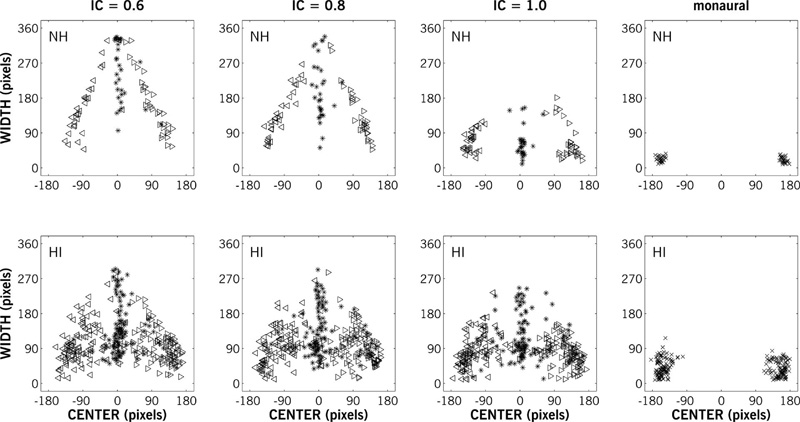
Figure 9.
Response widths as a function of response centers in pixels for NH (n = 4) and HI (n = 16) participants (rows) and IC (columns) for stimuli with simulated lateral positions of −30° (left triangles), 0° (asterisks) and +30° (right triangles). The rightmost column shows response widths and centers for the monaural (L/R channel only) stimuli. The extent of the mannequin head (360 pixels) affected the response widths for ±30° stimuli. Response centers were more scattered and response widths were less affected by IC for HI relative to NH participants.

