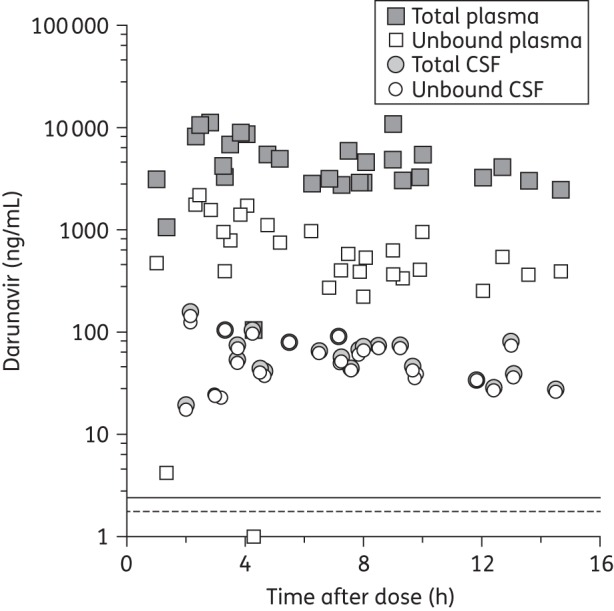
Figure 1.

Total and unbound plasma and CSF darunavir concentrations with post-dose sampling time. The horizontal broken line shows the median IC50 (1.78 ng/mL). The horizontal continuous line shows the median IC90 (2.43 ng/mL). The LLQs were 0.39 ng/mL (CSF) and 3.9 ng/mL (plasma).
