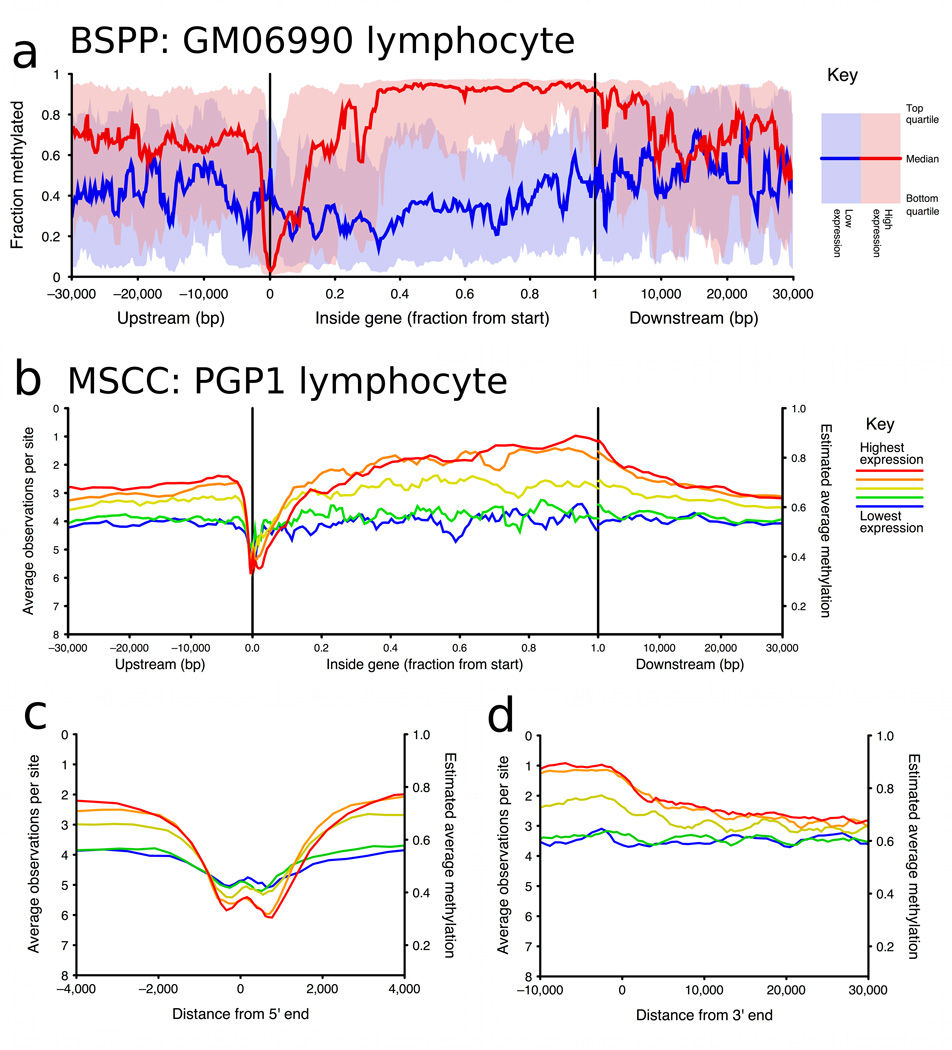
Figure 2. Methylation vs gene positions, split by gene expression level.
a, Running median methylation vs. gene position for high and low expression genes in ENCODE pilot regions of the GM06990 cell line (based on BSPP data). b–d are based on MSCC data and share the same key. b, Running average MSCC HpaII observations vs. gene position for all genes in the PGP1 EBV-transformed lymphoblastoid cell line, and split into five groups based on expression level. Contribution of each MSCC data point was normalized for local CpG density, MspI control counts and, for sites within the gene, for gene length. c, Running average methylation vs. position relative to transcription start site (TSS). d, Running average methylation vs. position relative to transcriptional end of genes (for genes at least 15kb in length).

