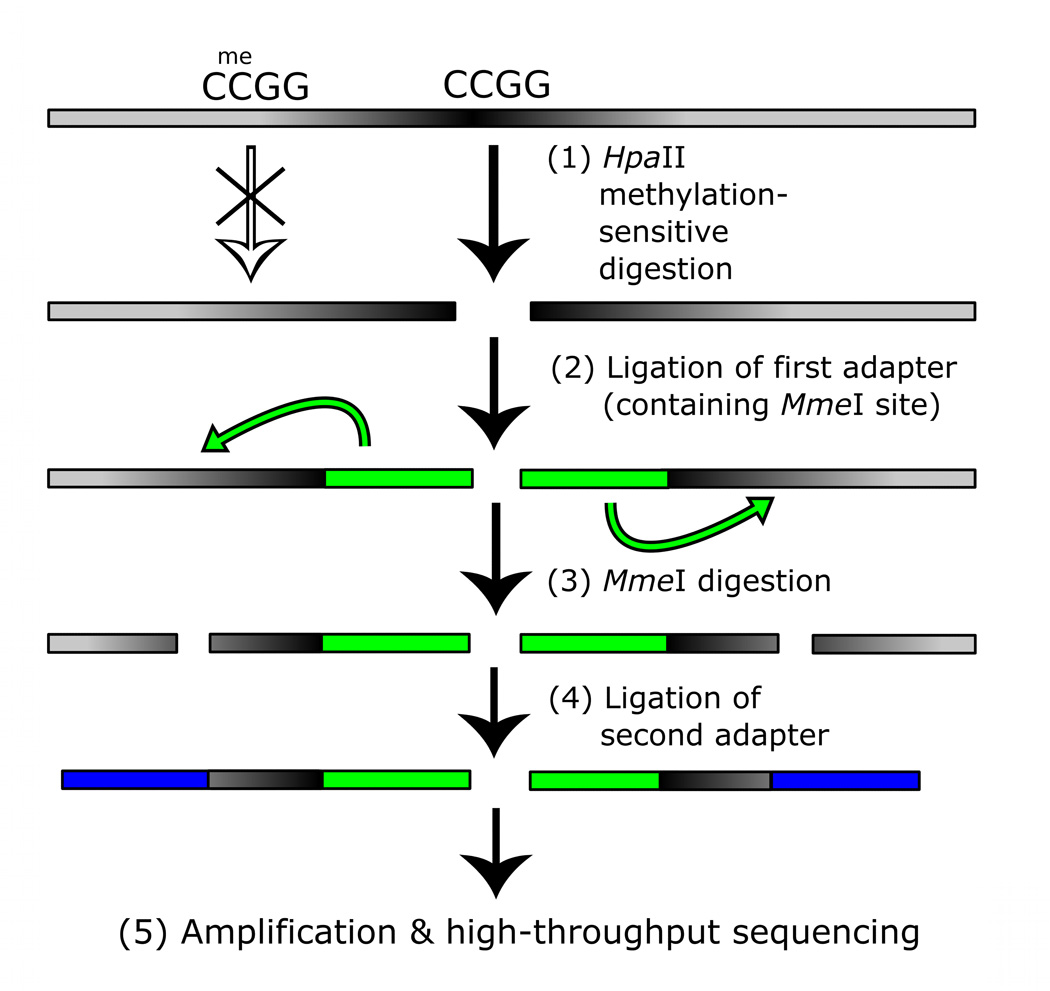
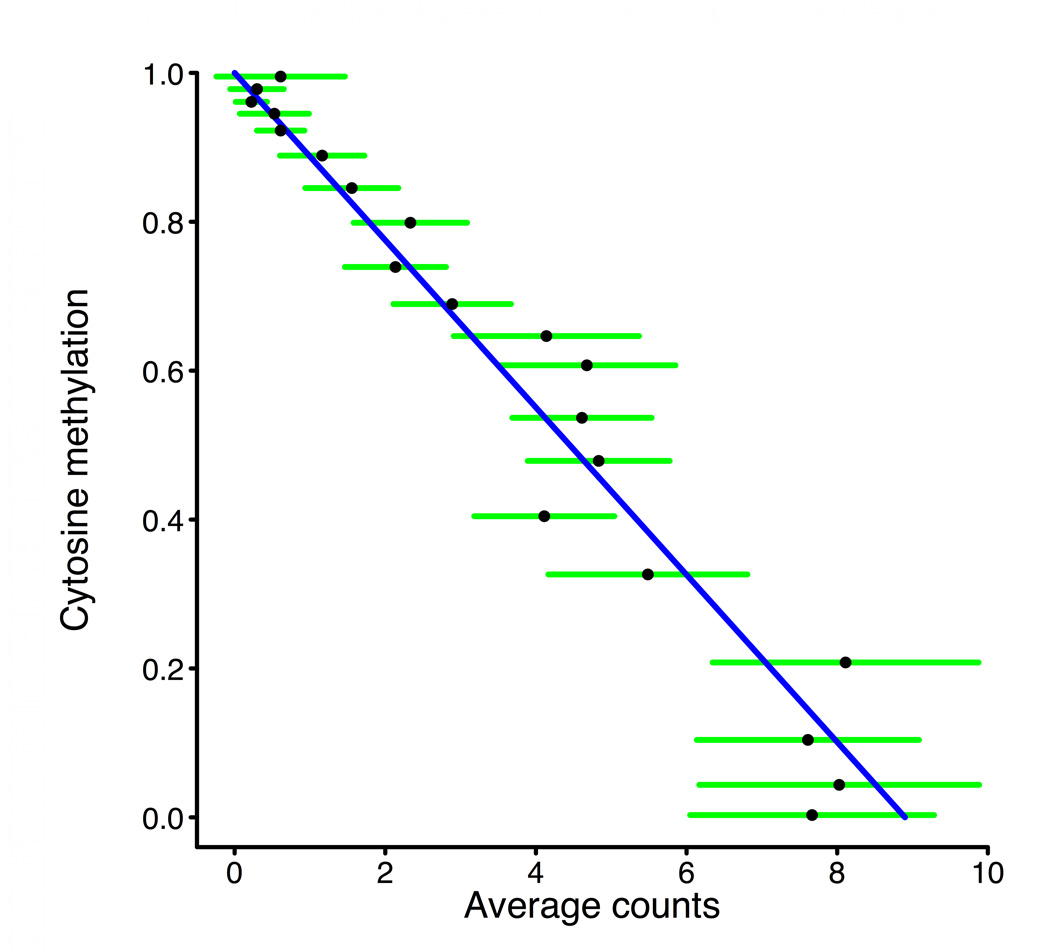
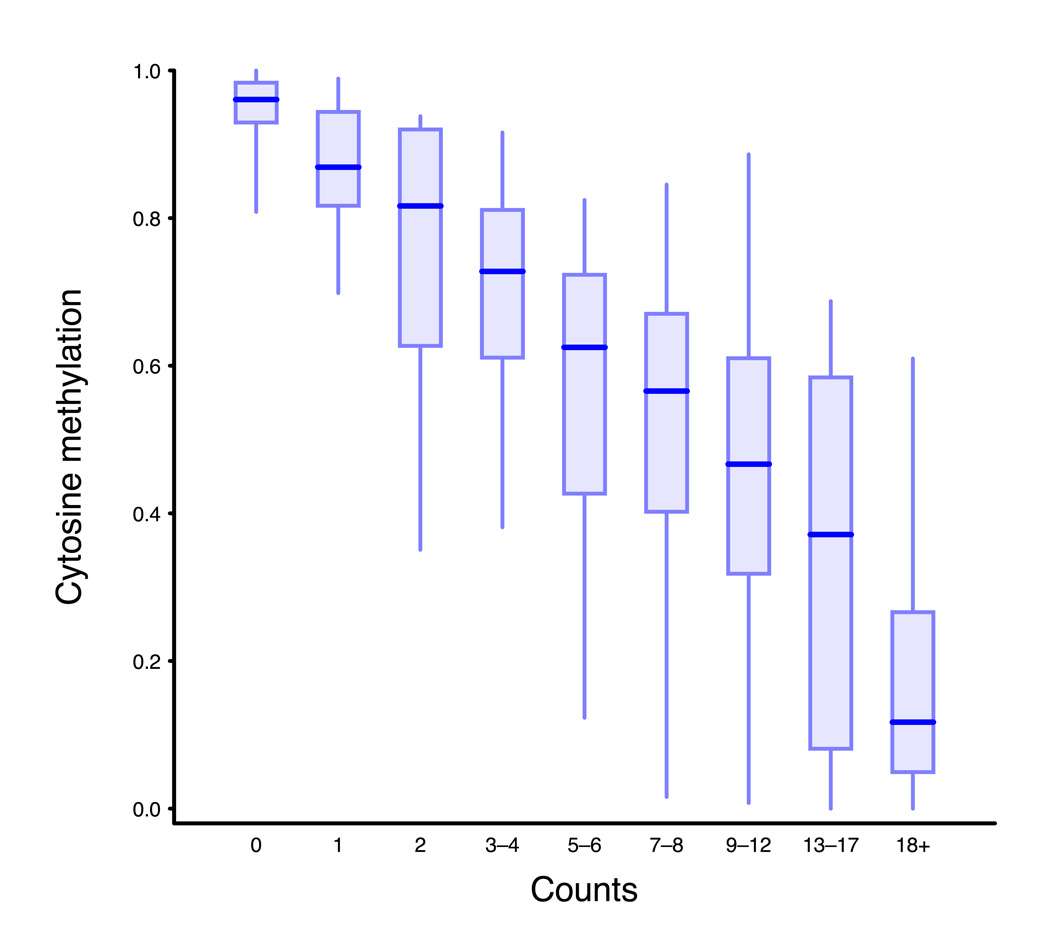
Figure 3. MSCC technology allowing accurate estimate of methylation levels.
a, Scheme of generation of a methyl sensitive cut site library. (1) HpaII digestion cuts genomic DNA at all unmethylated CCGG sites only; (2) The first adapter containing an MmeI recognition site is ligated; (3) MmeI digestion cuts into the unknown genomic sequence to produce an 18–19 bp tag; (4) A second adapter is added by ligation; (5) The library is amplified and sequenced. The number of reads for a given site is correlated with the amount of digestion that occurs there and thus an indication of methylation level. b, BSPP methylation vs. MSCC counts data was grouped according to the BSPP-determined methylation levels into 20 bins, with each bin containing an equal number of data points. The mean number of counts (black points) is linearly related to the mean methylation of a bin (blue best fit line is shown). Green error bars represent the 95% confidence interval based on the standard error of the mean for bin. c, Summed MSCC counts for paired tag sites was binned according to show how well individual sites predict methylation. Horizontal bars represent median methylation as determined by BSPP, boxes represent the quartiles, and whiskers mark the 5th and 95th percentiles.


