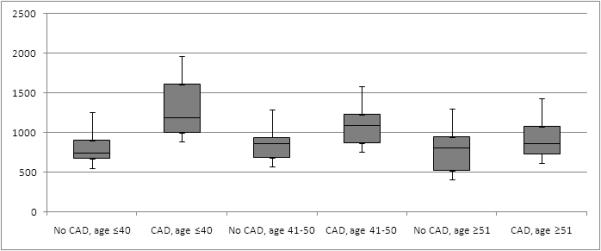
Figure 1.

Cholesteryl ester values by the presence of coronary disease and age
The boxplots represent the values of the sum of cholesteryl esters 16:1 and 18:1 measured in participants. The box margins represent the 25th and 75th percentiles, the bar within the box represents the median, and the whiskers represent the range of values.
