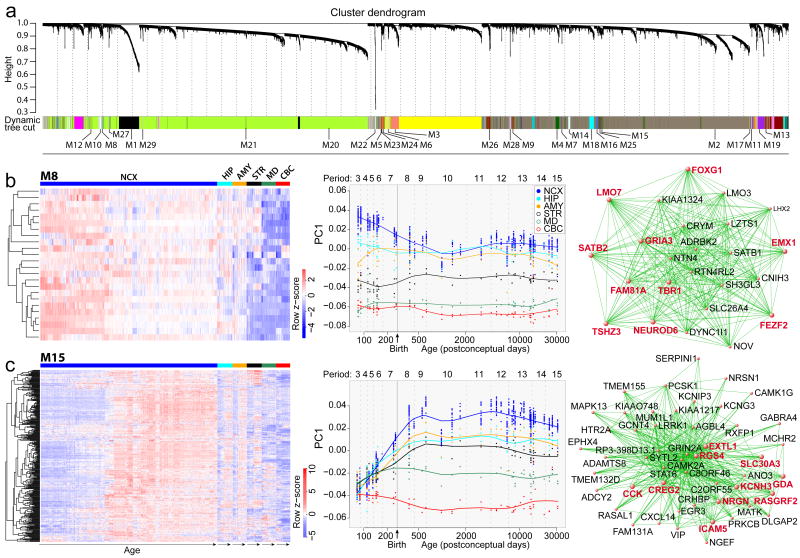
Figure 4. Global co-expression networks and gene modules.
a, Dendrogram from gene co-expression network analysis of samples from period 3 to 15. Modules of co-expressed genes were assigned a color and number (M1 to M29). b, Heat map of genes in M8 (left) showing the spatiotemporal expression pattern after hierarchical clustering. The expression values for each gene are arranged in the heat map, ordered first by brain regions, then by age and last by NCX areas. Spatiotemporal pattern of M8 (middle) summarized by the first principal component (PC1) for expression of genes in the module across age. Top 50 M8 genes (right), defined by the highest intramodular connectivity, Top 10 hub genes are in red. c, Same analyses were performed for M15. Results for other modules are available in Supplemental Information.

