
Figure 7.
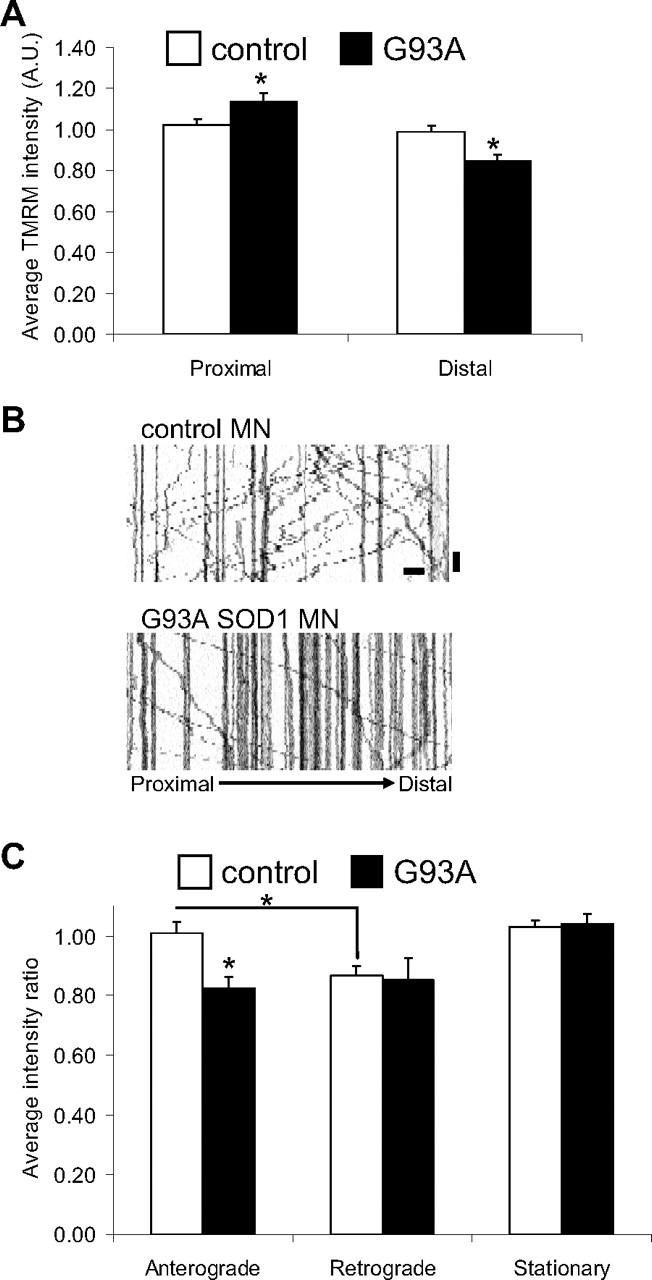
Impairment of mitochondrial bioenergetics in mutant SOD1 motor neuron axons. A, Average TMRM fluorescence intensity (mitochondrial membrane potential) of all mitochondria in proximal and distal segments of non-transgenic and G93A SOD1 motor neurons (8 div). n (mitochondria) = 285 control and 207 G93A. B, Representative kymographs of TMRM-labeled mitochondria from distal axonal segments of control and mutant SOD1 motor neurons, used to correlate membrane potential and mitochondrial transport. Scale bars, 10 μm (horizontal), and 1 min (vertical). C, TMRM intensity measured as the integrated fluorescence in each mitochondrion/area in pixels and expressed as a proportion of average potential in all mitochondria. n (axons) = 12 control and 10 G93A. Data from 3 independent motor neuron isolations. The error bars represent ± SE. *p < 0.05.