
Figure 9.
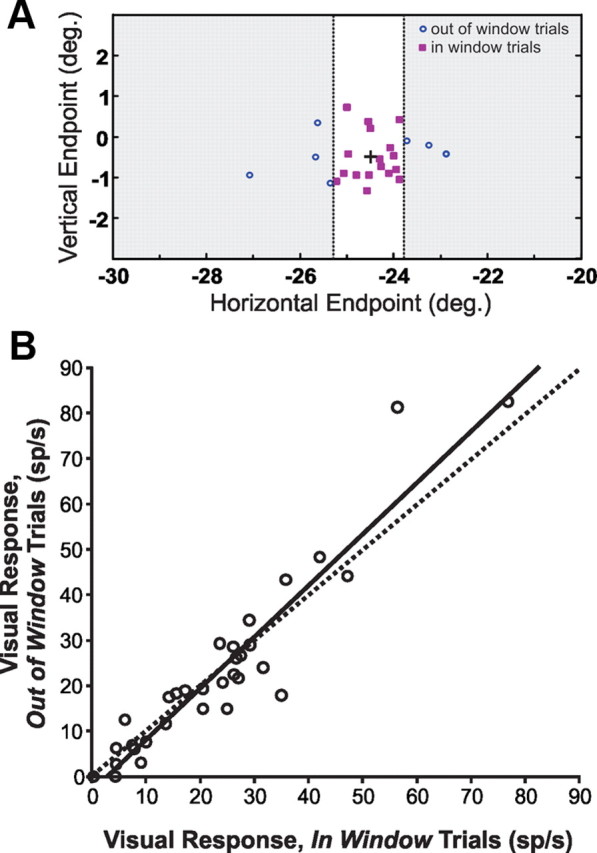
Saccadic endpoint analysis. A, Single neuron example illustrating the procedure by which the data were separated into a central cluster of endpoints (in window trials) and outlying flanks of endpoints (out of window trials). B, Comparisons of reafferent visual responses associated with the different endpoint categories, for data collected in parallel configuration. Solid line, Linear regression (y = 1.13x − 3.16); dashed line, unity line. Saccadic endpoints had no systematic effect on the reafferent visual responses.