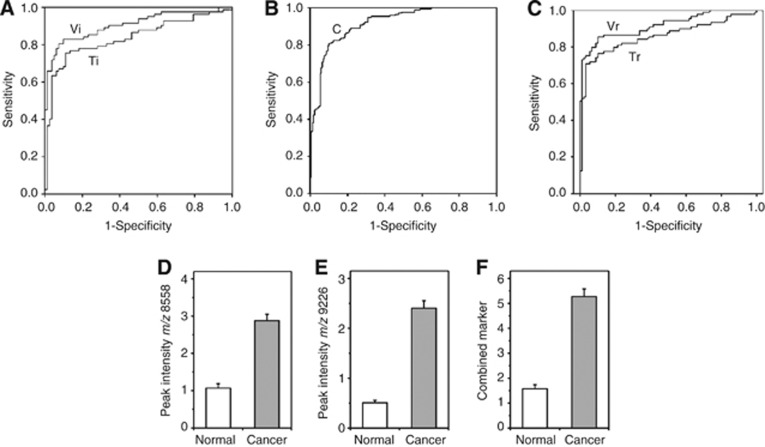
Figure 1.
Performance of two protein peaks individually and in combination. (A) The ROC area-under-curve (AUC) after cross-validation was 0.87 (Ti) for the combination of peaks at m/z 1842, 8599 and 9292. For the independent validation sample set, the average value of ROC AUC was 0.91 (Vi). (B) Combination of the discovery and validation sets. The sensitivity and specificity of the combination peaks of m/z 8558 and 9226 were 77.2% and 88.9% with a ROC AUC value of 0.92. (C) Retesting of initial training and validation sets. The ROC AUC values for these tests were 0.86 (Tr) and 0.91 (Vr) for training and validation sets, respectively. (D) Mean peak intensity values±s.e.m. (normal vs cancer) for the marker at m/z 8558; (E) mean values±s.e.m. for the marker at m/z 9226, and (F) mean values±s.e.m. for the two markers combined. For the comparisons in (D–F), n=171, P<0.001.

