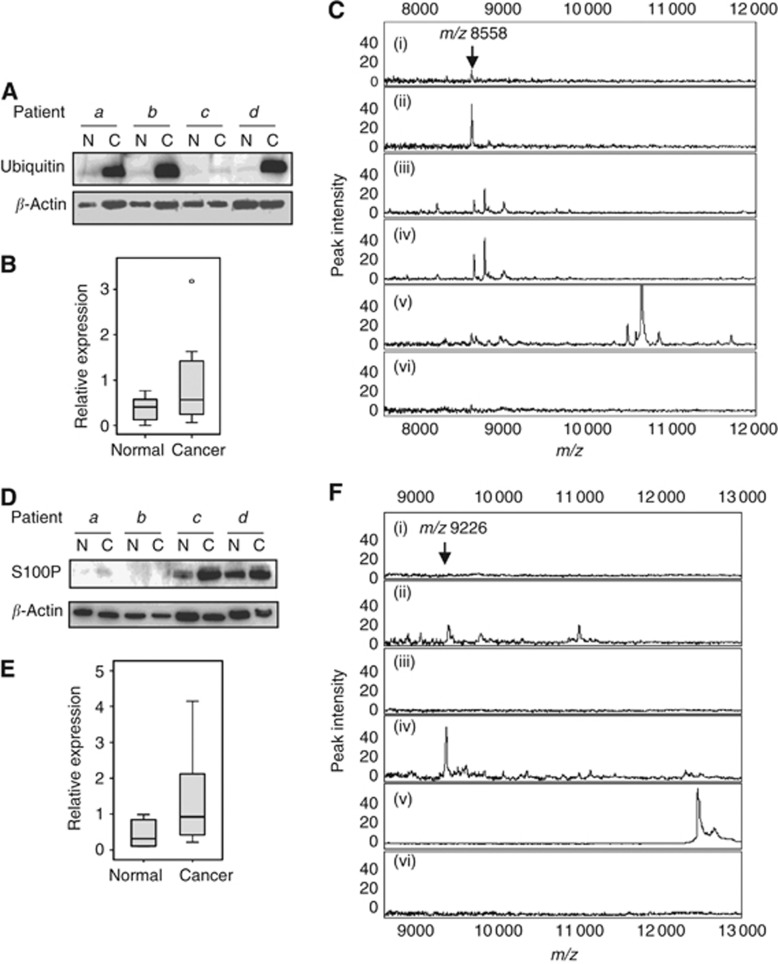
Figure 2.
Immunological validation of ubiquitin and S100P. (A) For ubiquitin, four BC and corresponding AT extracts were analysed by immunoblotting, indicating relative upregulation of ubiquitin in some breast cancer patients. β-Actin is shown as a loading control. (B) Densitometric analysis of ubiquitin western blots of eight sample pairs. Box plot shows median and upper and lower quartiles; lines show maximum and minimum values. P=0.017, Wilcoxon signed-rank test. (C) Mass spectrometry (MS) spectra of proteins bound to immobilised mouse anti-ubiquitin antibody. Samples were (i) patient 1 normal tissue, (ii) patient 1 cancer tissue, (iii) patient 2 normal tissue, (iv) patient 2 cancer tissue, (v) recombinant His-tagged ubiquitin, and (vi) patient 2 cancer tissue, mouse IgG control. Arrow indicates the mass of monomeric ubiquitin, m/z 8558. N=normal tissue; C=cancer tissue. (D) For S100P, four BC and corresponding AT extracts were analysed by immunoblotting, indicating relative upregulation of S100P in some breast cancer patients. β-Actin is shown as a loading control. (E) Densitometric analysis of S100P Western blots of 8 sample pairs. Box plot shows median and upper and lower quartiles; lines show maximum and minimum values. P=0.012, Wilcoxon signed-rank test. (F) Mass spectrometry spectra of proteins bound to immobilised rabbit anti-S100P antibody. Samples were (i) patient 3 normal tissue, (ii) patient 3 cancer tissue, (iii) patient 4 normal tissue, (iv) patient 4 cancer tissue, (v) recombinant His-tagged S100P, and (vi) patient 4 cancer tissue, rabbit IgG control. Arrow indicates the mass of the S100P form of m/z 9226. N=normal tissue; C=cancer tissue.

