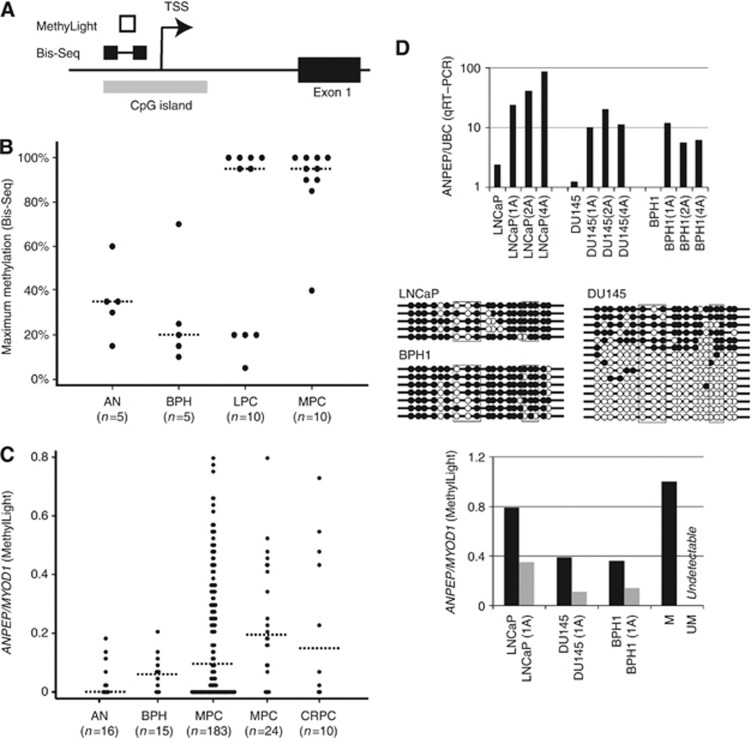
Figure 2.
(A) Structure of ANPEP genomic locus. Location of the promoter-associated CpG island is shown by a grey box. DNA regions analysed by bisulphite sequencing (Bis-Seq) and quantitative methylation-specific PCR (MethyLight) are indicated above (dumbbell and white box, respectively). TSS, transcription start site within CpG island. The figure is not to scale. (B) Dot plot of ANPEP promoter methylation in a small clinical sample set analysed by bisulphite sequencing. Percent methylated CpG sites/total number of CpG sites in the most heavily methylated clone is given for each sample (see also Supplementary Figure S1). (C) Dot plot of relative ANPEP promoter methylation (normalised to MYOD1) in a second and larger clinical sample set, determined by MethyLight analysis. (B and C) Horizontal dashed lines indicate median methylation for each group. Sample numbers in each group are given in brackets. (D) Normalised ANPEP expression in three prostate cell lines treated with 1 μℳ (1A), 2 μℳ (2A), or 4 μℳ (4A) 5-aza-2′-deoxycytidine or untreated is shown at the top. The expression of ANPEP was determined by qRT–PCR using UBC for normalisation, and further normalised to ANPEP/UBC expression in a pool of four adjacent nonmalignant prostate tissue samples (arbitrarily set to 100; not shown). The expression of ANPEP was induced by 5-aza-2′-deoxycytidine in all cell lines. Bisulphite sequencing results for ANPEP in prostate cell lines is shown below. Open and closed circles indicate unmethylated and methylated CpGs, respectively. Each row represents one clone. The CpG sites interrogated by MethyLight analysis are highlighted by black boxes. The promoter methylation levels of ANPEP in treated and untreated cell lines, methylated (M) and unmethylated (UM) control DNA samples, determined by MethyLight analysis, is shown at the bottom.

