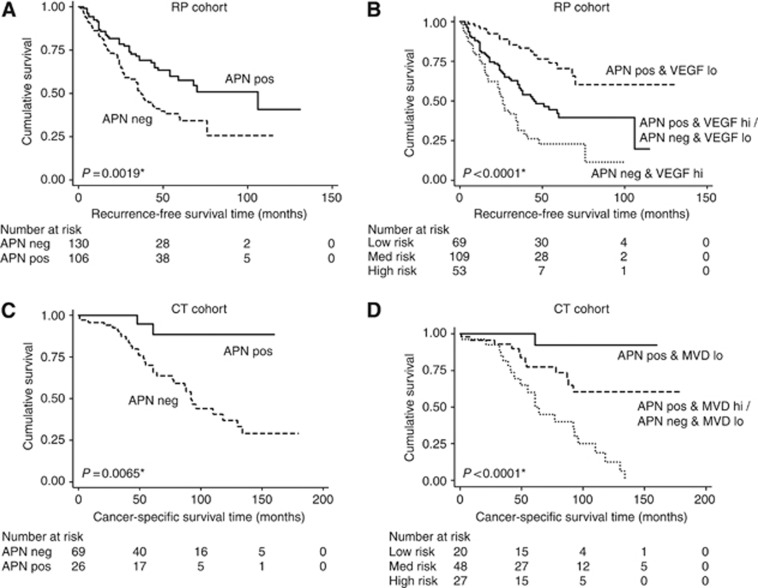
Figure 3.
Kaplan–Meier plots of RFS for the RP cohort (A and B) and CSS for the CT cohort (C and D). The P-values for two-sided log-rank statistics are given, comparing patients with negative (IHC score=0) or positive (IHC score=1+ or 2+) APN immunoreactivity (A, C), as well as patients with positive/negative APN staining in combination with low/high VEGF staining (score 0–2 vs score 3–5) in the RP cohort (B), or low/high microvessel density (MVD; dichotomised at median) in the CT cohort (D). *Significant P-values.

