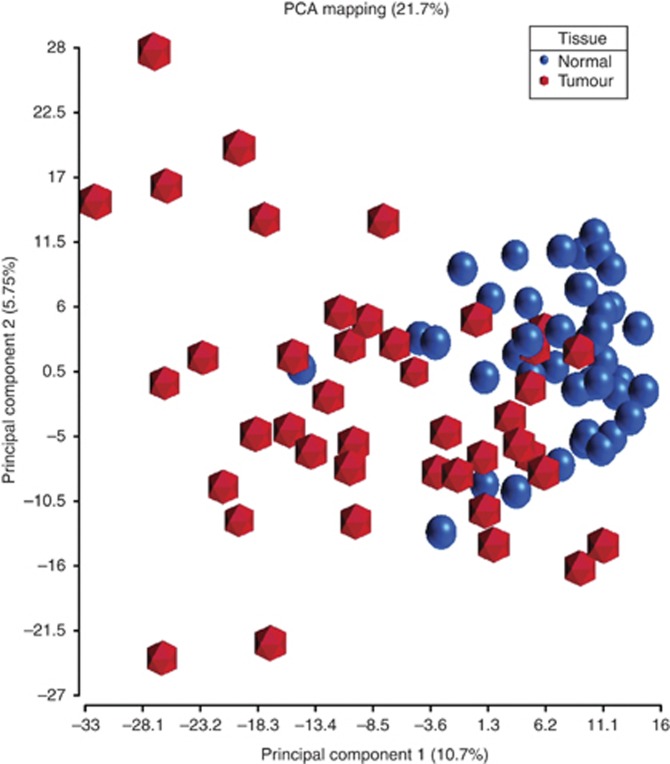
Figure 1.
Principal components analysis showing the distinction between tumour and normal samples based on methylation. Average β values from 43 tumour and matched normal samples were employed in the analysis. Separation between tumour (hexagon) and normal (sphere) samples can be visualised in the plot along the first principal component, with a few misplaced samples.

