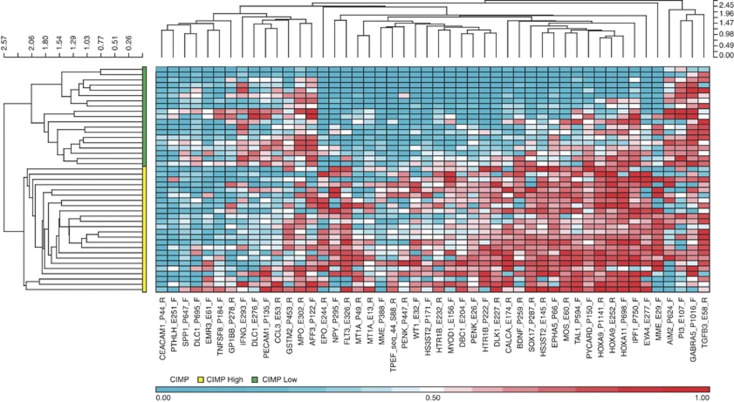
Figure 3.
Hierarchical clustering heatmap and dendrogram of tumour samples based on methylation markers differential between tumour and normal tissues. Average β values from the selected 48 probes were used for hierarchical agglomerative clustering using Euclidean distance and average linkage. CpG island methylator phenotype (CIMP) groups are shown by the two clusters on the dendrogram left of the heatmap, the bottom cluster designated as ‘CIMP-high' and the top as ‘CIMP-low'.

