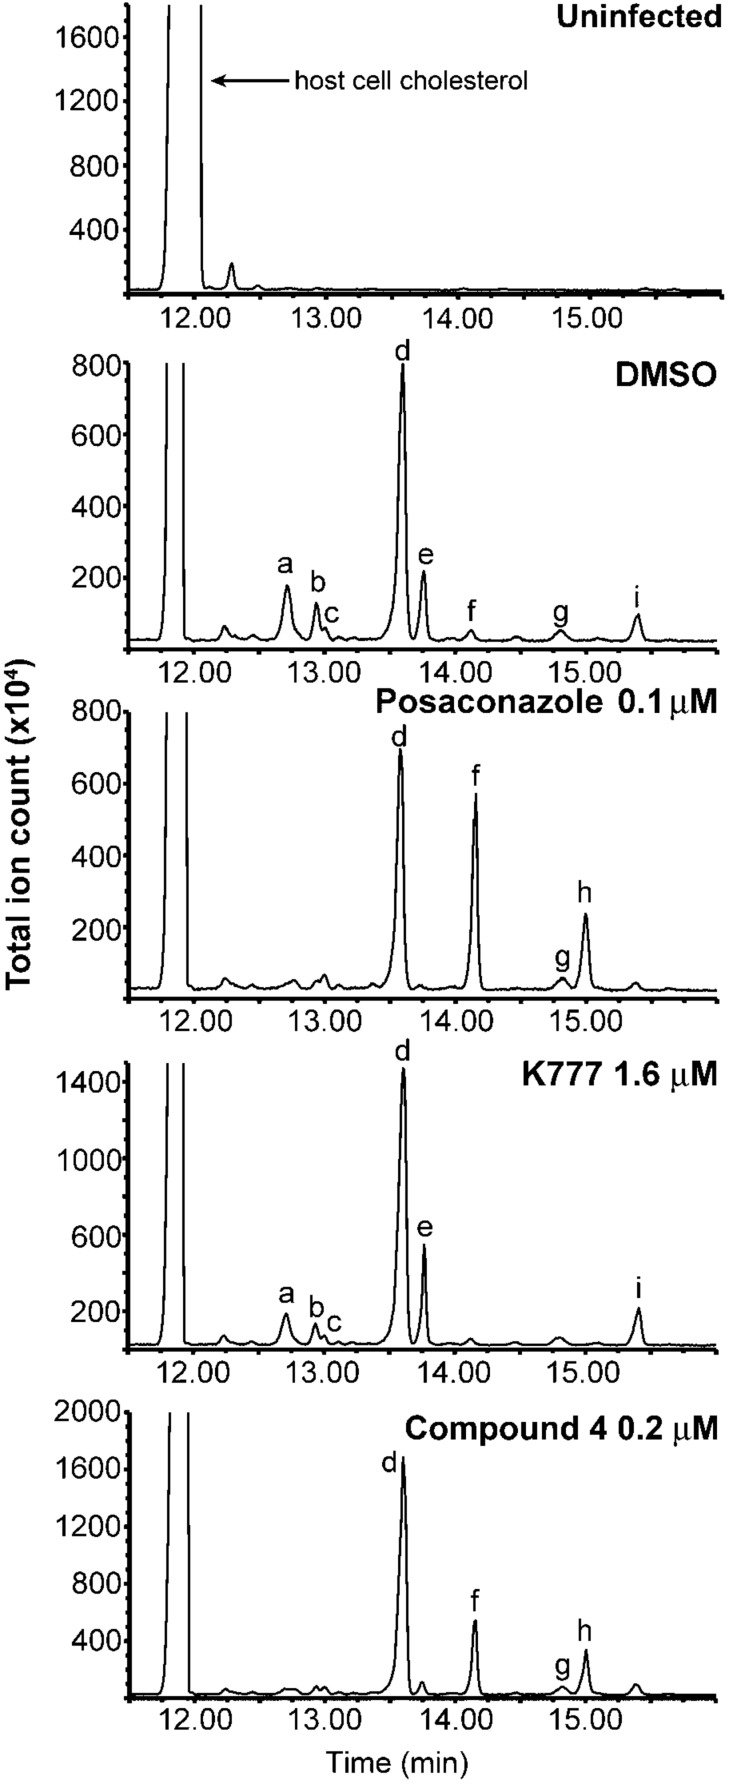
Figure 4.
GC/MS analysis of lipid extracts from T. cruzi parasites treated with test compounds. DMSO and K777 (1) were used as negative controls; posaconazole served as a positive control. The analysis of 4 was performed concurrently with other CYP51 inhibitors described recently [33] and, thus, the spectra for the controls shown above are reproduced from the earlier report. Spectra of lipid extracts from parasites treated with 3, 6, 7, and 8 are provided in Supporting Information File 1. Uninfected host cell panel (top) demonstrates that chromatographic peaks labeled a to i in subsequent panels are of T. cruzi origin. These peaks are assigned as a - cholesta-7,24-dien-3β-ol, [M]•+ = m/z 454; b - cholesta-8,24-dien-3β-ol (zymosterol), [M]•+ = m/z 470; c - 24-methyl-7-en-cholesta-en-3β-ol, [M]•+ = m/z 472; d - ergosta-7,24-diene-3β-ol (episterol), [M]•+ = m/z 470; e - ergosta-8,24-diene-3β-ol (fecosterol), [M]•+ = m/z 470; f - lanosterol, [M]•+ = m/z 498; g - 4-methylepisterol, [M]•+ = m/z 484; h - eburicol, [M]•+ = m/z 512; i - 24-ethyl-7,24(24’)-encholestadien-3β-ol, [M]•+ = m/z 484.

