
Figure 2.
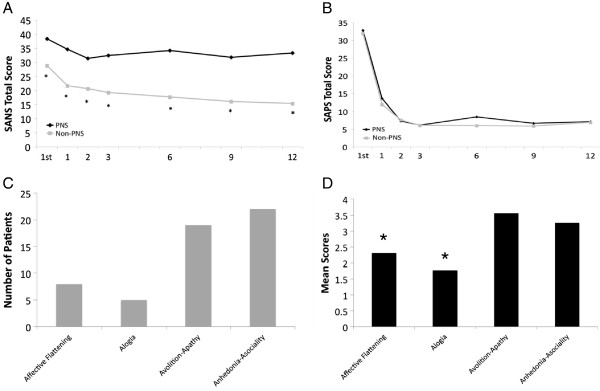
A) SANS total scores from first assessment to month 12; B) SAPS total scores from first assessment to month 12 *= p<0.001; C) Frequency of patients that met PNS_1 criteria for the 4 subdomains of the SANS; D) Mean scores for the 4 subdomains of the SANS for patients meeting the PNS_1 criteria. N= 158 (44 PNS and 114 non-PNS) *= Domain was significantly different than all the other three SANS domains. 1st= First Assessment. Note: SANS total scores do not include the “Attention” domain.