Figure 4.
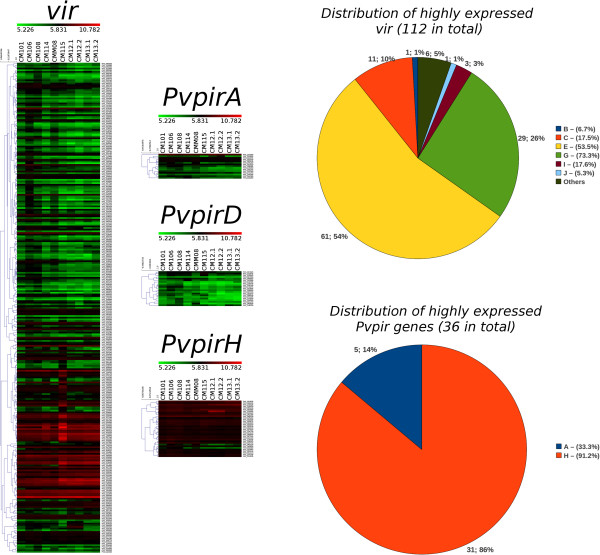
Gene expression profiles of vir and pvpirA, pvpirD, and pvpirH genes in symptomatic P. vivax patients. Left panel. Heatmaps drawn for the expression data of ten P. vivax patients [23]. Only vir and the newly defined pvvirA, pvpirD and pvpirH are shown. Color scale spans from 5.226 to 10.782 (upper bar), which represent the minimum and maximum expression values observed for this set of genes and samples (median value = 5.831). Dendrograms on the left of heatmaps show the result of average-linkage hierarchical algorithm. Right panel. Pie charts showing the distribution of expressed genes with expression values ≥ 5.831 for all samples. Percentages next to each (sub)family label indicate the proportion of genes within the corresponding (sub)family.

