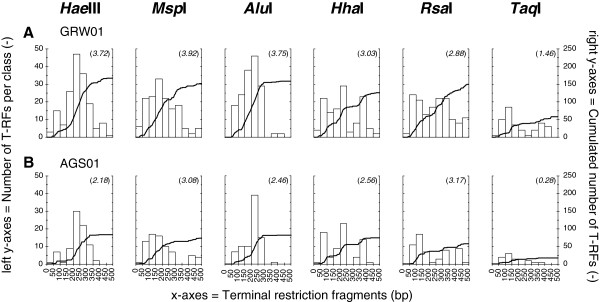
Figure 2.

Density plots displaying the repartition of T-RFs along the 0–500 bp domain with different endonucleases. The effect of the different restriction endonucleases HaeIII, AluI, MspI, HhaI, RsaI and TaqI was tested on pyrosequencing datasets collected from the samples GRW01 (A) and AGS01 (B). Histograms represent the number of T-RFs produced per class of 50 bp (to read on the left y-axes). Thick black lines represent the cumulated number of T-RFs over the 500-bp fingerprints (to read on the right y-axes). The total cumulated number of T-RFs corresponds to the richness index. The number given in brackets corresponds to the Shannon′s diversity index.
