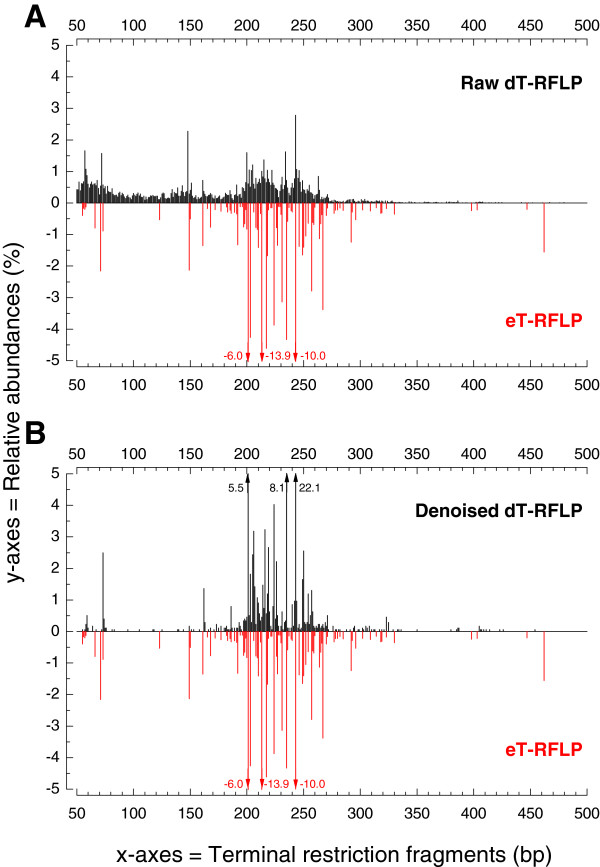
Figure 3.
Mirror plot displaying the cross-correlation between digital and experimental T-RFLP profiles. This mirror plot was generated for the complex bacterial community of sample GRW01. Comparison of mirror plots constructed with raw (A) and denoised sequences (B). Relative abundances are displayed up to 5% absolute values. For those T-RFs exceeding these limits, the actual relative abundance is displayed beside the peak.

