
Figure 8.
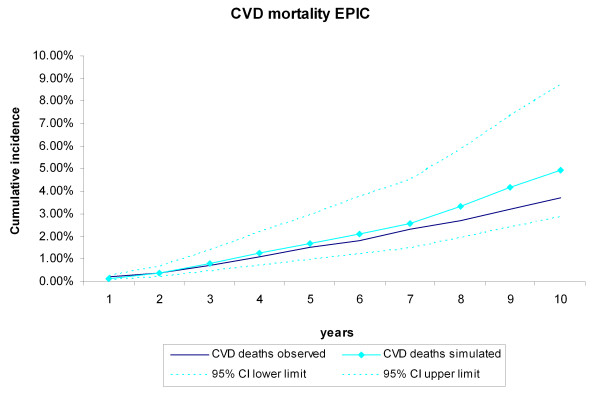
Cardiovascular disease (CVD) mortality during 10 years of follow-up in the recalibrated model. Simulated versus observed values for the European Prospective Investigation of Cancer (EPIC)-Norfolk data.
Official websites use .gov
A
.gov website belongs to an official
government organization in the United States.
Secure .gov websites use HTTPS
A lock (
) or https:// means you've safely
connected to the .gov website. Share sensitive
information only on official, secure websites.
Cardiovascular disease (CVD) mortality during 10 years of follow-up in the recalibrated model. Simulated versus observed values for the European Prospective Investigation of Cancer (EPIC)-Norfolk data.