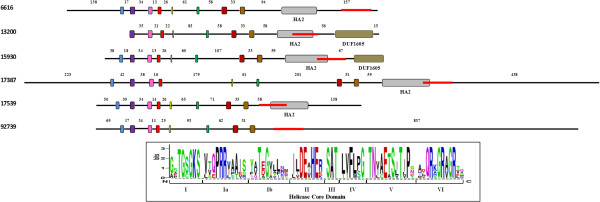
Figure 2.

Schematic diagram of the DEAH-box RNA helicase family in G. lamblia. Each HA2 domain is represented in gray and the DUF1605 domain is represented in brown, both inside the C-terminal region. Red lines within the C-terminal extensions represent the region amplified in the qPCR for each putative helicase. The representation is to scale. Inset: sequence LOGO view of the consensus amino acids. The height of each amino acid represents the degree of conservation. Colors indicate properties of the amino acids, as follows: green (polar), blue (basic), red (acidic) and black (hydrophobic).
