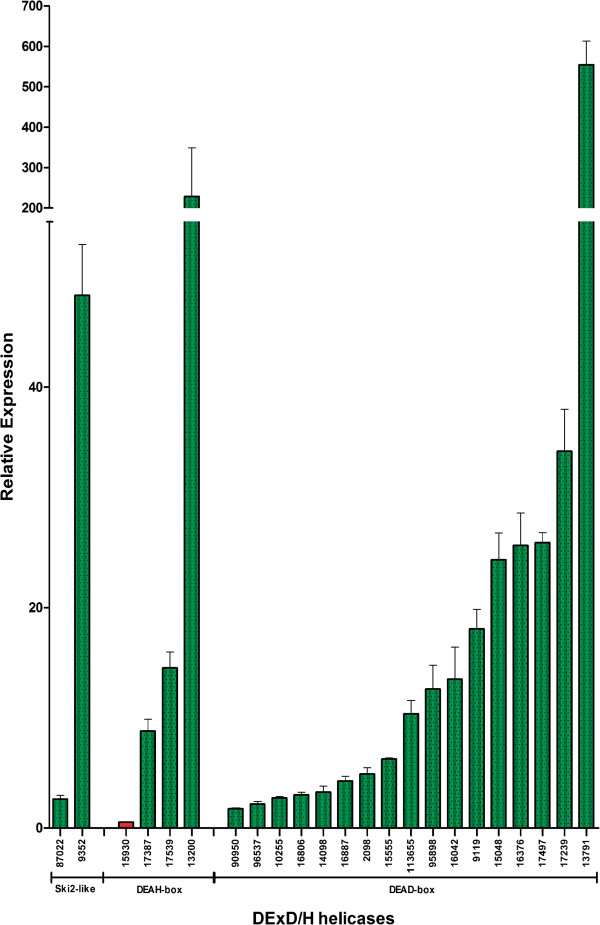
Figure 5.
Real time quantitative PCR (qPCR) of RNA helicases from G. lamblia during encystation. The graph is a representative qPCR determination of three independent biological replicates. The ORFs are indicated at the bottom of the graph and separated in families. The up-regulated ORFs are represented in green bars, and the down-regulated ones, in red bars, each one with the corresponding relative expression ratio.

