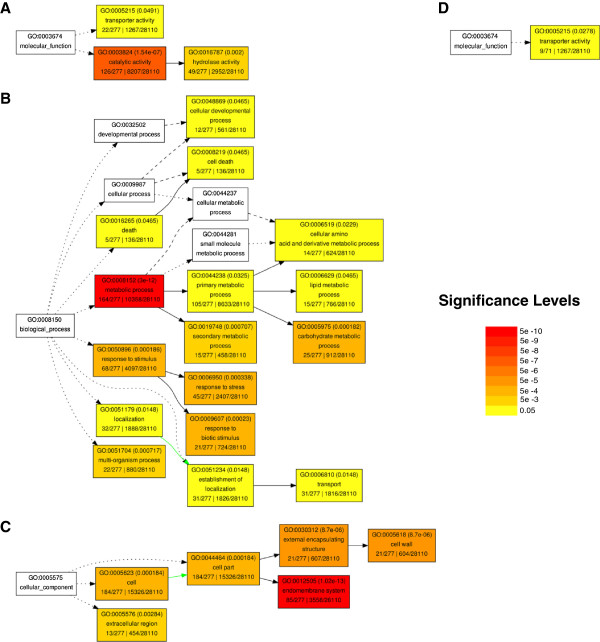
Figure 2.
GO Slim Plant term enrichment. Genes with lower expression in hae hsl2 (A) Biological Process (B) Molecular Function (C) Cellular Component. GO Slim Plant term enrichment of genes with higher expression in hae hsl2 (D) Molecular Function. Color Scale represents FDR adjusted p-values < 0.05. Solid, dashed, and dotted lines represent either two, one, or zero enriched terms at either end of the line.

