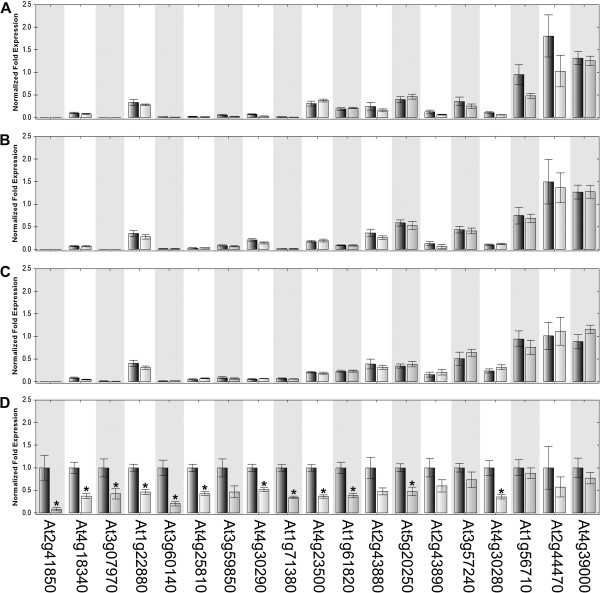
Figure 5.
qPCR of hydrolases with lower expression in ida (grey bars) RNA-Seq data in comparison to wild type (black bars). (A) stage 12 flower receptacles (B) stage 13 flower receptacles (C) stage 14 flower receptacles (D) stage 15 flower receptacles. (*) significantly lower in ida (**) significantly higher in ida. Error bars are standard error of the mean.

