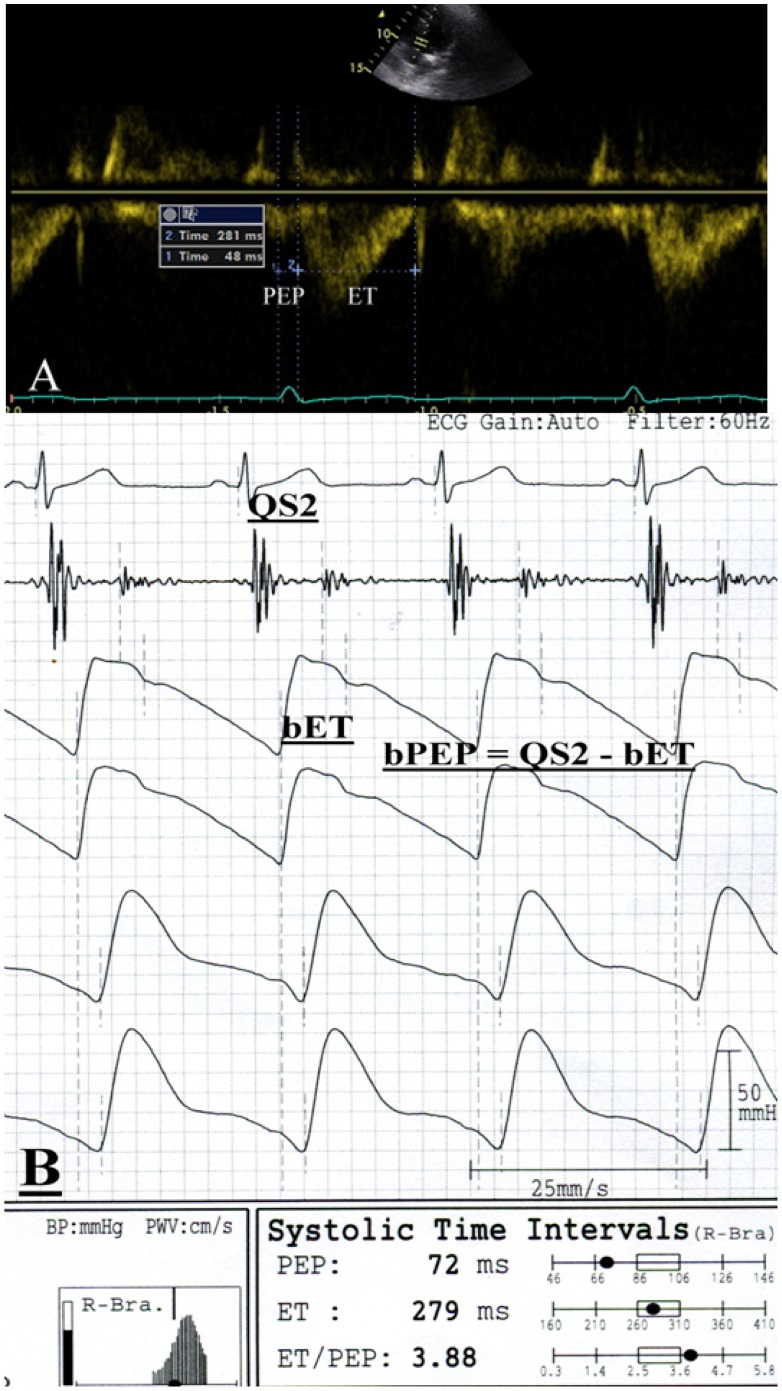
Figure 1. A representative case to illustrate the measurements of pre-ejection period (PEP), ejection time (ET), brachial PEP and brachial ET.
In this case, the ET measured from the onset to the end of systolic flow of left ventricular outflow tract (LVOT) was 281 ms and PEP measured from the onset of the QRS complex to the onset of LVOT systolic flow was 48 ms (A). The bET measured from the foot to the dicrotic notch of the brachial pulse volume waveform was 279 ms and QS2 measured from the onset of the QRS complex to the first high-frequency vibrations of the aortic component of the second heart sound was 351 ms. The bPEP automatically calculated by QS2– bET was 72 ms (B). The bET was slightly shorter than the ET and the bPEP was longer than the PEP.

