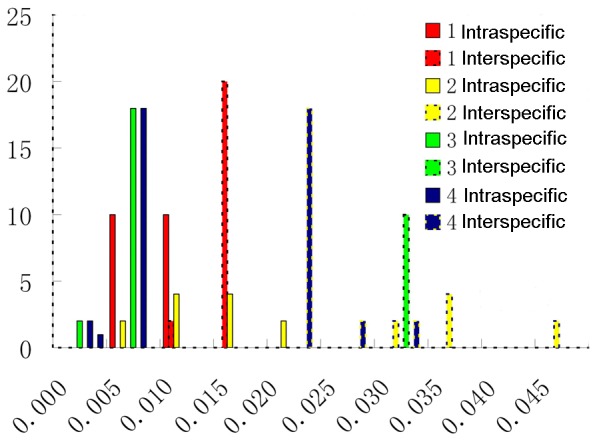
Figure 2. Barcoding gaps between the four quarantine species and their closest relatives.

The X-axis relates to the K2P distances of the three combined DNA regions (ndhF, trnS-trnG and waxy) between the four quarantine species and their closest relatives. 1. S. elaeagnifolium; 2. S. carolinense; 3. S. torvum; 4. S. rostratum. The Y-axis corresponds to the number of occurrences.
