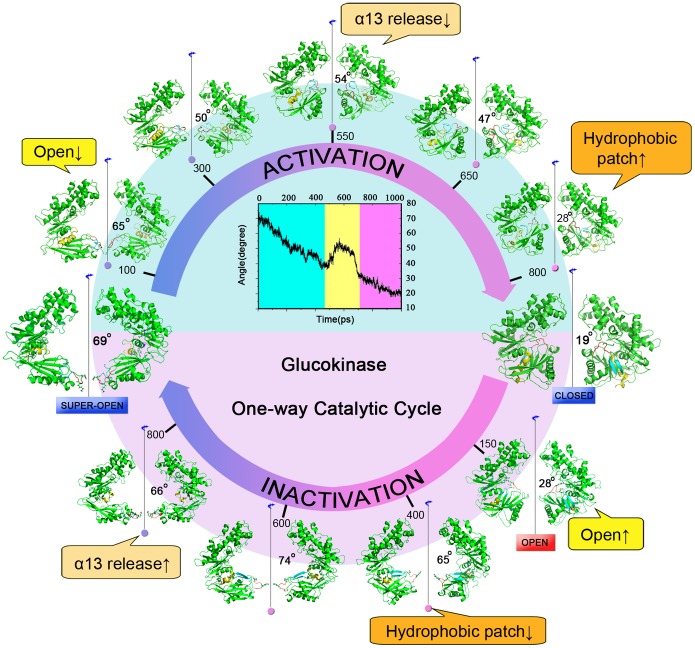
Figure 3. The conformational transition pathway of GK between the super-open state and the closed state.
The center image is the time dependence of the cleft angle between the two domains in the process of GK activation. Around the upper semicircle of the center image, five snapshots are extracted from trajectory B1 at the activated times of 100 ps, 300 ps, 550 ps, 650 ps and 800 ps. Two crystal structures of GK in the super-open and closed states are shown at either end of the catalytic cycle, and four snapshots at the inactivated times of 150 ps, 400 ps, 600 ps and 800 ps that were found previously are also shown in the lower semicircle (9). Three important components of conformational change in GK are labeled in comment frames. Loop I between the α4 and β7 segments is in red; the β6 and β7 strands are in cyan; helix α13 is in yellow.

