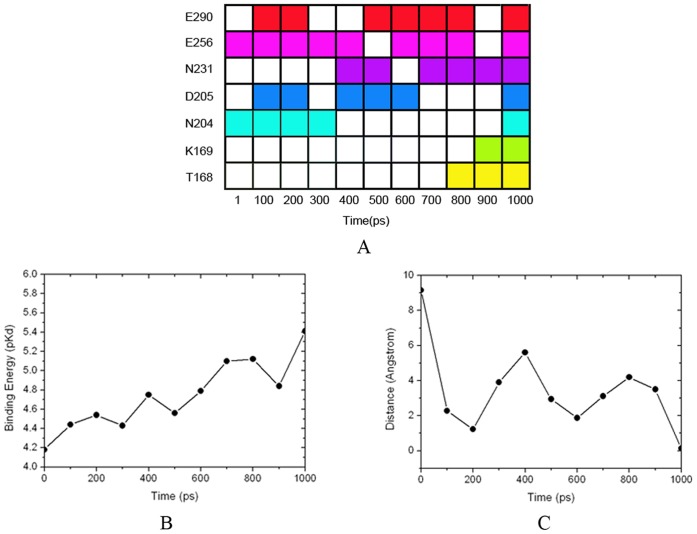
Figure 8. Process of glucose binding to GK.
(A) The residues of GK in contact with glucose during the TMD simulation, represented by different colors. The colored frame means glucose has contact with the residue, while the blank frame means glucose does not have contact with the residue. (B) Binding affinity between glucose and GK calculated by X-Score. (C) wRMSD of the heavy atoms between the crystal pose and docked pose of glucose.

