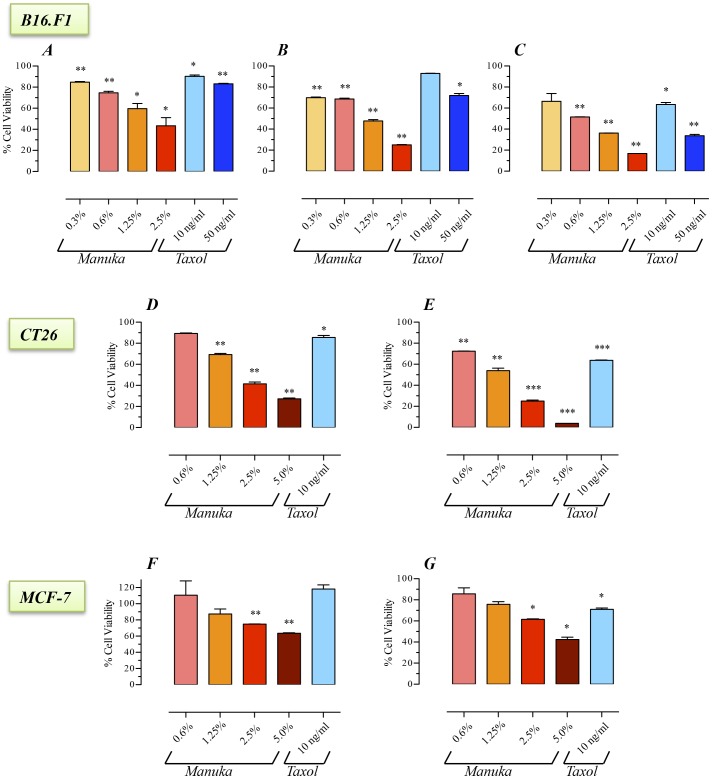
Figure 1. Inhibition of cancer cell proliferation by manuka honey.
B16.F1 (graphs A–C), CT26 (graphs D , E) and MCF-7 (graphs F , G) cells were plated at 5×10³ cells per well and incubated for 24 hr (graphs A, D, F), 48 hr (graph B) or 72 hr (graphs C , E , G) in the absence or presence of the indicated concentrations of manuka honey (range 0.3% to 5.0% w/v), or taxol (10 ng/ml or 50 ng/ml final concentration). At the end of the incubation period, cell viability was determined using CellTiter-Glo luminescent assay. Results are expressed as percentage viability in treated cell cultures compared to control, untreated, cells and are representative of 3 (for B16.F1 cells) or 2 (for CT26 and MCF-7 cells) independent experiments. Asterisks denote statistically significant differences in viability of experimental groups compared to control (*, p<0.05; **, p<0.01; ***, p<0.001).

