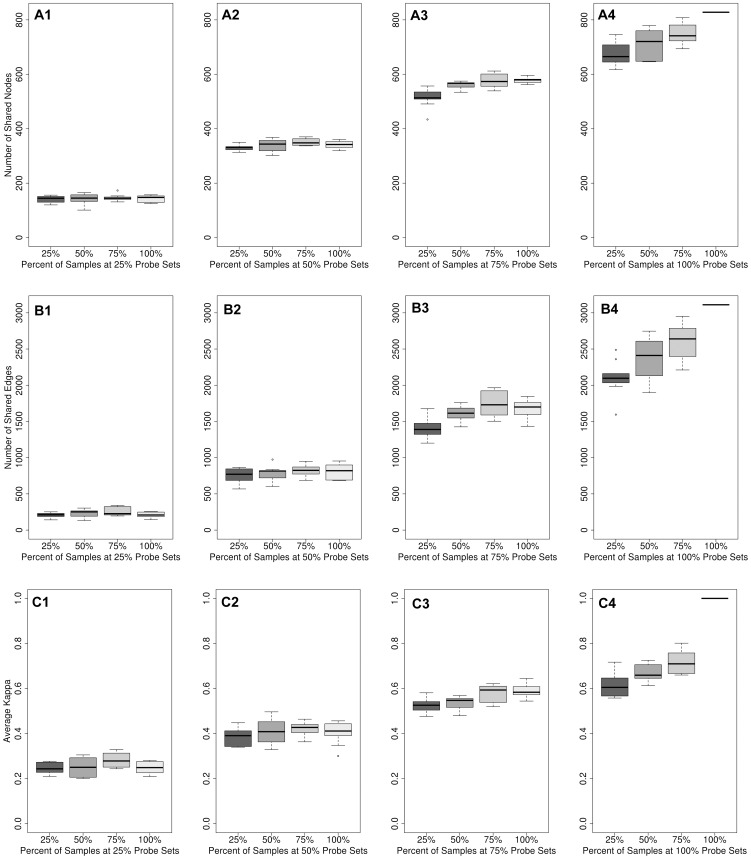
Figure 1. Topological and functional properties of the human networks with randomly removed samples and probe sets.
A) The number of nodes shared with the global network for each perturbed network is shown at various sample removal rates (x-axis) when probe sets were retained at rates of 25% (A1), 50% (A2), 75% (A3) and 100% (A4); B) The number of edges shared with the global network for each perturbed network is shown at various sample removal rates (x-axis) when probe sets were retained at rates of 25% (B1), 50% (B2), 75% (B3), and 100% (B4); C) The average Kappa, κ, (functional similarity) between modules in the perturbed network with modules in the global network is shown at various sample removal rates (x-axis) when probe sets were retained at rates of 25% (C1), 50% (C2), 75% (C3), and 100% (C4). The single line in the far right of plots A4, B4 and C4 represents the global network.

