
Figure 4. ERK1/2 and AKT activation in AGS cells upon infection with H.
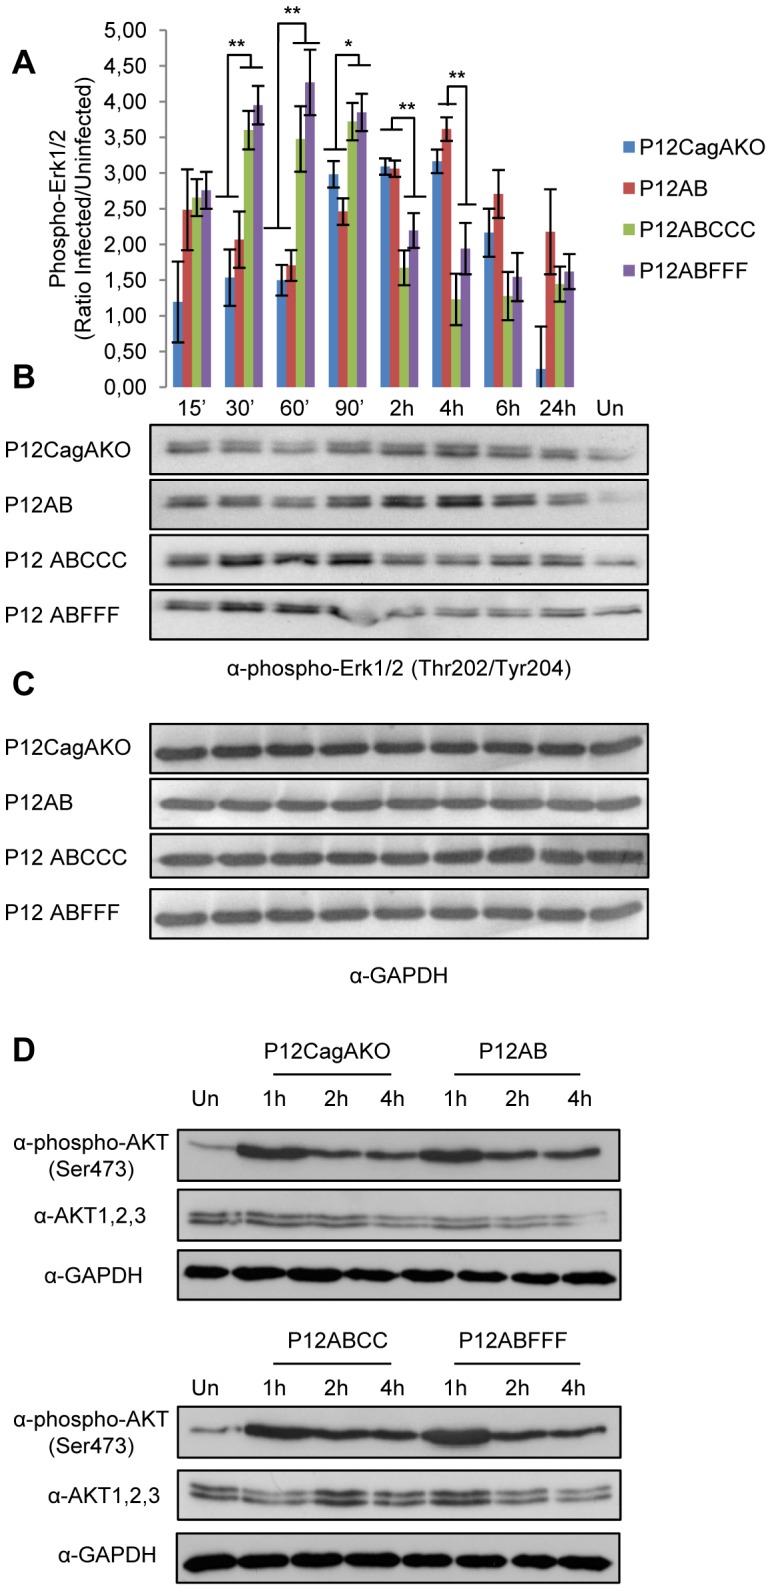
pylori mutant strains expressing CagA with phosphorylation-functional (EPIYA-C) or -defective (EPIFA-C) motifs. (A) Quantification of ERK1/2 phosphorylation at Thr202/Tyr204 by band densitometry in two independent experiments is depicted by plotting phospho-ERK1/2 (ratio infected to uninfected cells) for each time point.vStatistical analysis was done by Student t-test and levels of significance depicted are *<0.05 and **<0.01. (B) Representative ERK1/2 phosphorylation at Thr202/Tyr204 and (C) the corresponding GAPDH expression. (D) Phosphorylation of AKT at Ser473 determined in total protein lysates from AGS cells infected with corresponding AKT1, 2, 3 and GAPDH expression. Un: uninfected cells.