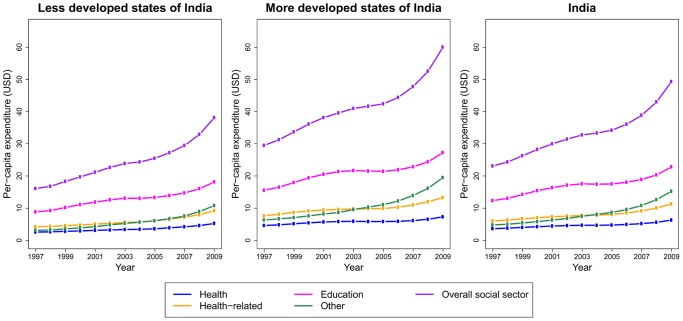
Figure 1. Per-capita health, health-related, education, other, and overall social sector expenditure, 1997–2009.
Per-capita expenditure is calculated as the sum of yearly expenditure across all states in our analysis divided by the sum of yearly population in these states and averaged for the five years ending in the index year. Expenditure is shown in constant 2009 prices (USD). Trends are shown for the less developed and more developed state of India and for India as a whole.

