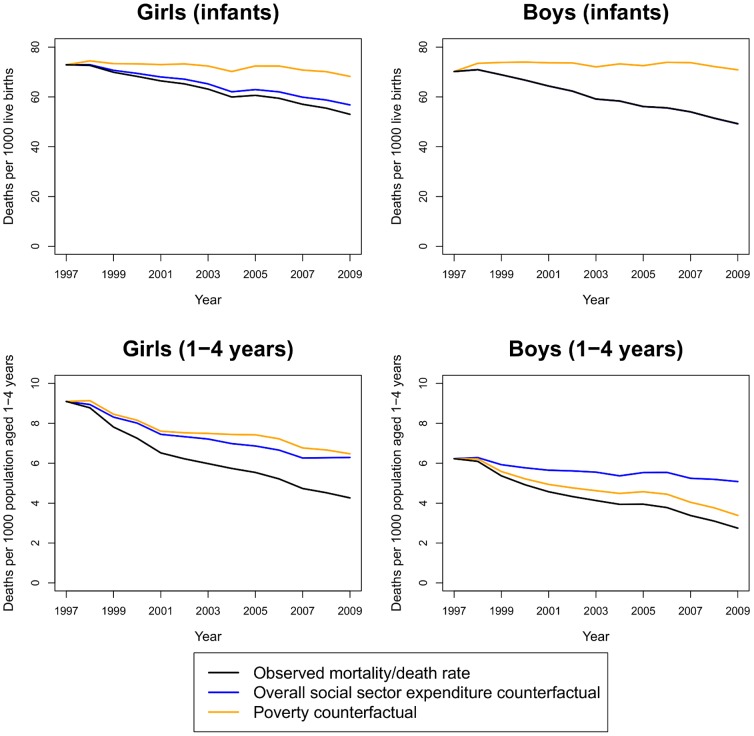
Figure 3. Observed and counterfactual mortality trends among infants and children aged 1–4 years, 1997–2009.
The observed mortality rate (for infants) or death rate (for age 1–4) is shown in black; the overall social sector expenditure counterfactual shows the predicted mortality/death rates if state per-capita overall social sector expenditure had remained at its 1997 level (blue); the poverty counterfactual shows the predicted mortality/death rates if poverty rates had remained at their 1997 levels (orange). (Note: the effect of overall social sector expenditure on mortality is essentially zero in boys less than one. Hence, the mortality rate under the overall social sector expenditure counterfactual [blue] coincides with the estimated mortality rate [black].)

