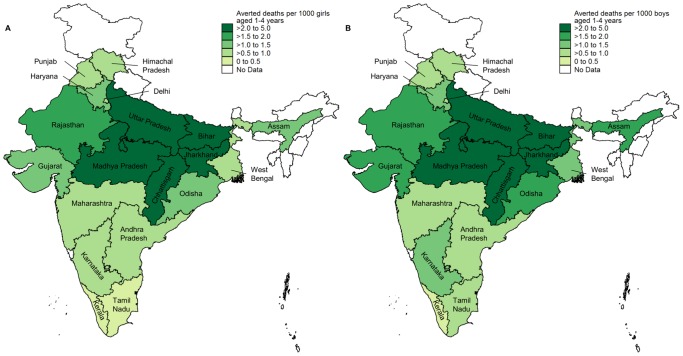
Figure 4. Averted deaths in 2009 by sex attributable to increased social sector spending since 1997.
Averted deaths per 1,000 population among A) girls and B) boys aged 1–4 years. The population denominator is the sex-specific population aged 1–4 years in 2009. In the analysis, data from Jharkhand was combined with that from Bihar and data from Chhattisgarh with that from Madhya Pradesh. The averted death rates shown in the maps for these four states are therefore the averted death rates obtained for Bihar combined with Jharkhand and Madhya Pradesh combined with Chhattisgarh.

