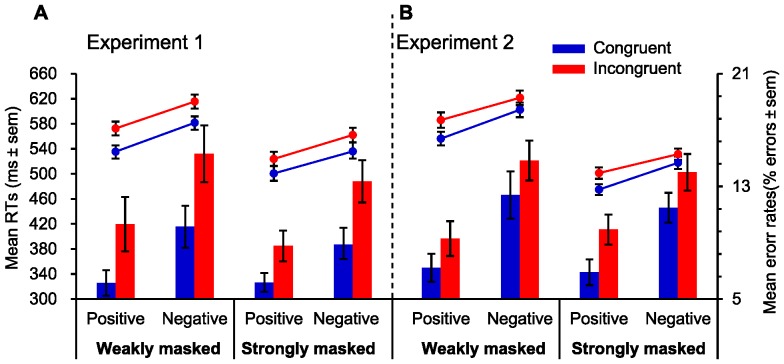
Figure 2. Mean RTs for correct trials and mean error rates as a function of target valence and valence congruency in weakly masked and in strongly masked groups.
(A) Emotional conflict results in Experiment 1. (B) Emotional conflict results in Experiment 2. Emotional conflict effects were significant on mean RTs and error rates for positive and negative conditions in the weakly masked and strongly masked groups. Points in the line chart represent the mean RTs in each experimental condition. Bar graphs represent the mean error rates in each experimental condition. Error bars depict standard errors of the means (SEM).

