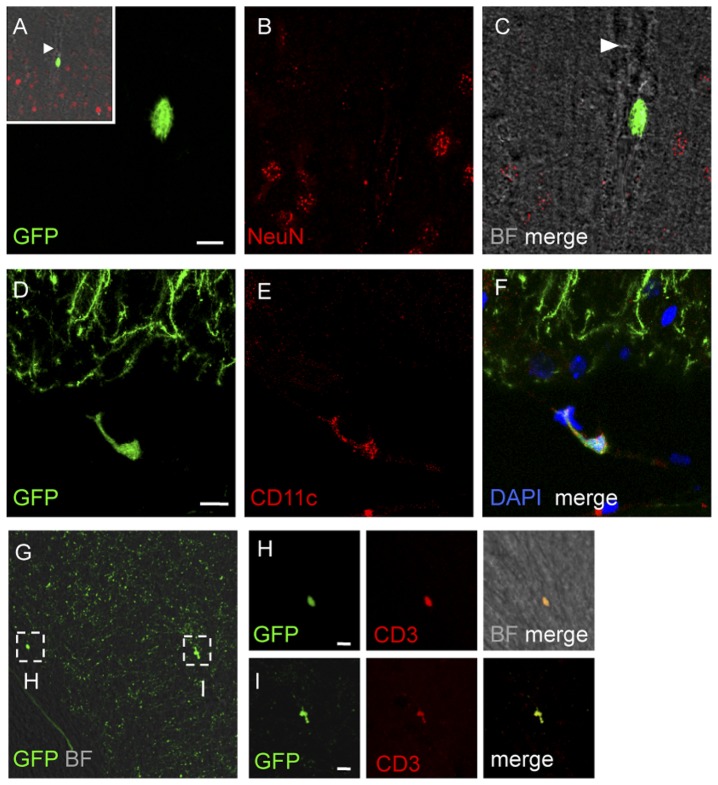
Figure 3. Immunophenotypic analysis of the non-neuronal GFP-tagged cells in the brain of thyGFP-M mice.
Confocal images of coronal brain sections showing non-neuronal GFP+ cells in several locations. (A–C) GFP+ cell into the lumen of a blood vessel (arrowhead) in layer II of the parietal cortex. Neuronal nuclei were stained with anti-NeuN, (B, C, red); the blood vessel is visualized in bright-field (insert A, C). The inset in A represents the area shown an high magnification in A–C. (D–F) GFP+ cell in the ependyma between hippocampus and thalamus. This cell is immunopositive to the dendritic cell marker anti-CD11c (E, red). Cell nuclei are stained with DAPI in F and represented in blue. (G–I) In the anterior hypothalamus a high number of small-sized GFP+ cells shows immunopositivity to the lymphocytes marker CD3+. Different morphologies of GFP+/CD3+ cells in the anterior hypothalamus. A small round (H, high magnification) GFP+/CD3+ cell and a GFP+/CD3+ cell showing an irregular shape (I, high magnification). Scale bars 10 µm.

