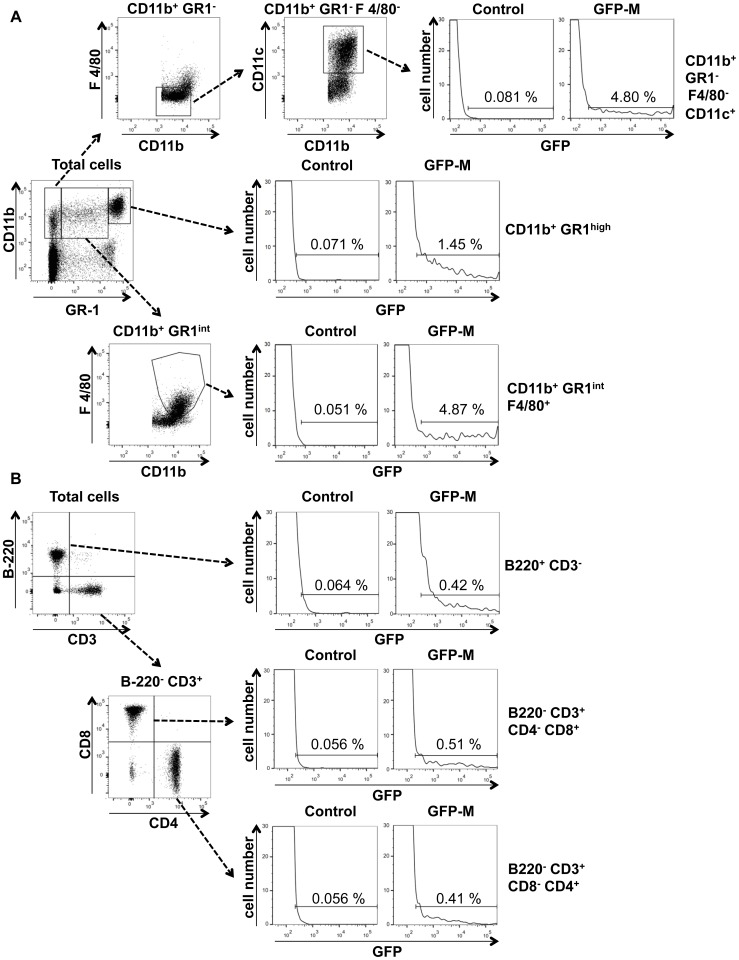
Figure 4. Cytofluorimetric analysis of GFP expression in blood cells from WT and thy1GFP-M mice.
(A) GFP expression was evaluated in monocytes as CD11b positive, GR-1 (Ly6C, Ly6G) intermediate, F4/80 positive cells (CD11b+ GR1int F4/80+); in granulocytes as CD11b positive, GR-1 highly positive cells (CD11b+ GR1high); in dendritic cells as CD11b positive, GR-1 negative, F4/80 negative, CD11c positive cells (CD11b+ GR1- F4/80- CD11c+). (B) Lymphocyte population were phenotypically characteryzed as B220 positive, CD3 negative cells (B lymphocytes, B220+ CD3-); B220 negative, CD3 positive, CD8 positive, CD4 negative cells (T cytotoxic cells, B220- CD3+ CD8+ CD4-) and B220 negative, CD3 positive, CD8 negative, CD4 positive (T helper, B220- CD3+ CD8- CD4+). Percentages inside the gates represent positive cells of parent populations. The figures shown are a representative experiment of 3 other separate experiments from 3 different mice performed with similar results.

