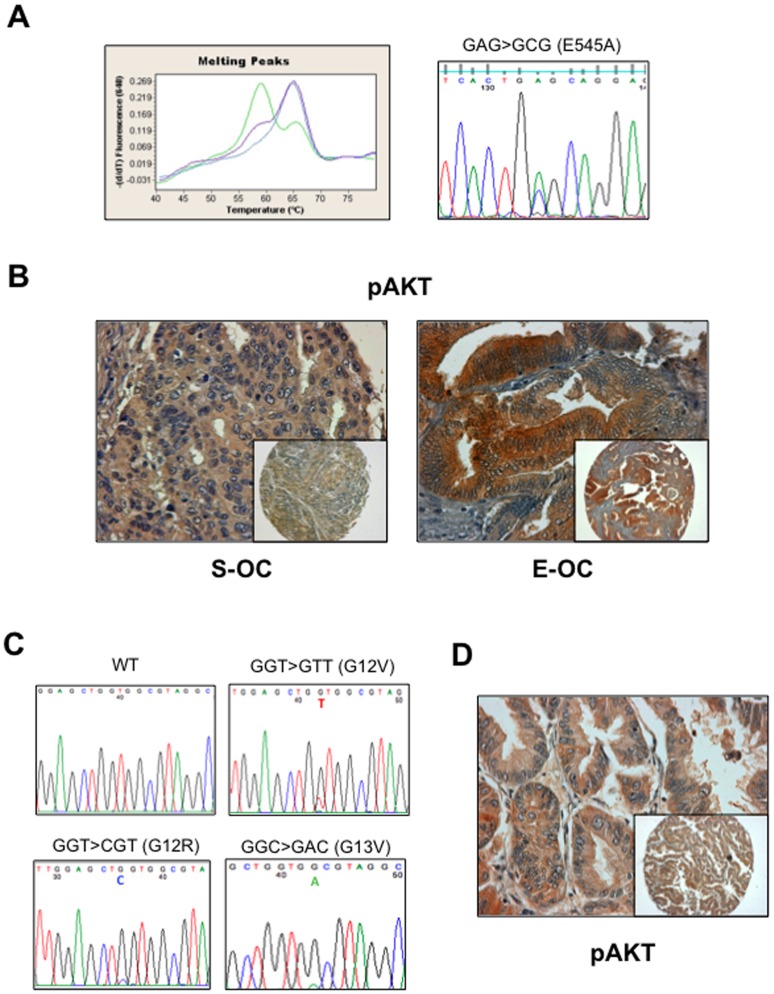
Figure 7. Mutation analysis of PIK3CA and KRAS genes in OC.
A. Detection of mutations in PIK3CA by LightCycler (left) and direct sequencing (right). On the left, the negative derivative of the fluorescence (−dF/dT) versus temperature graph shows peaks with different Tm. The wild type sample showed a single Tm at 66°C. The heterozygous mutant sample showed an additional peak at 57°C. On the right, GAG→GCG transition in codon 545 of exon 9 inducing the substitution of a glutammic acid with an alanine (E545A). B. pAKT staining of a mutated S-OC (left) and E-OC (right). C. Point mutations in exon 2 of KRAS gene: GGT→GTT (G12V), GGT→CGT (G12R), GGT→ GAC (G13V). D. pAKT staining of a KRAS mutated sample (MU-6).

