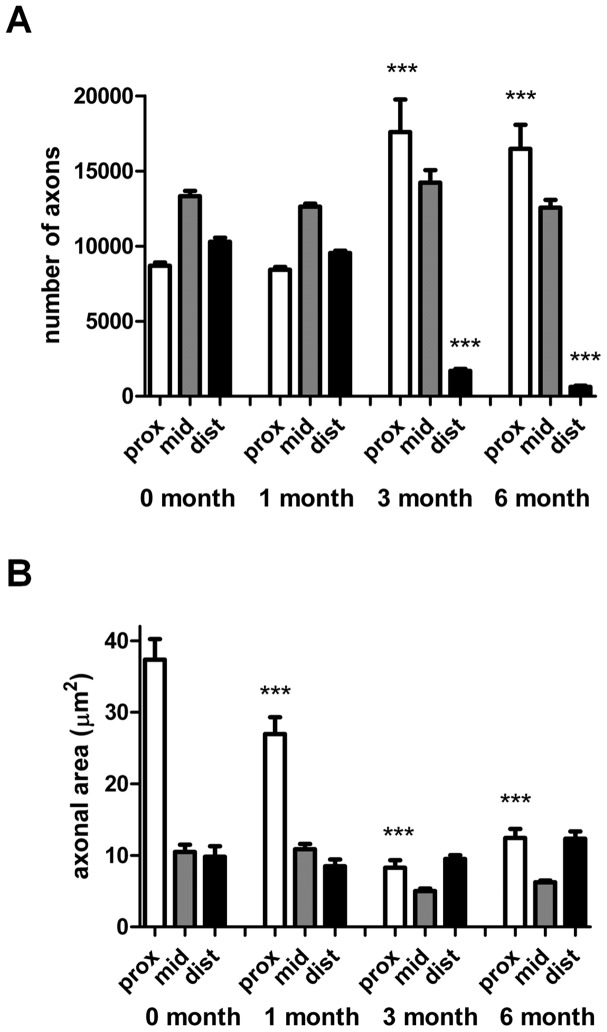
Figure 3. Quantitative analysis of (A) number of myelinated axons and (B) axonal area in the proximal stumps, mid-graft regions and distal stumps of animals undergoing sciatic nerve injury followed by either immediate or delayed nerve repair (at the time points indicated) with a 10.
mm graft. Values shown are mean±SEM, n = 5, ***p<0.001 significantly different from respective region after immediate nerve repair.

