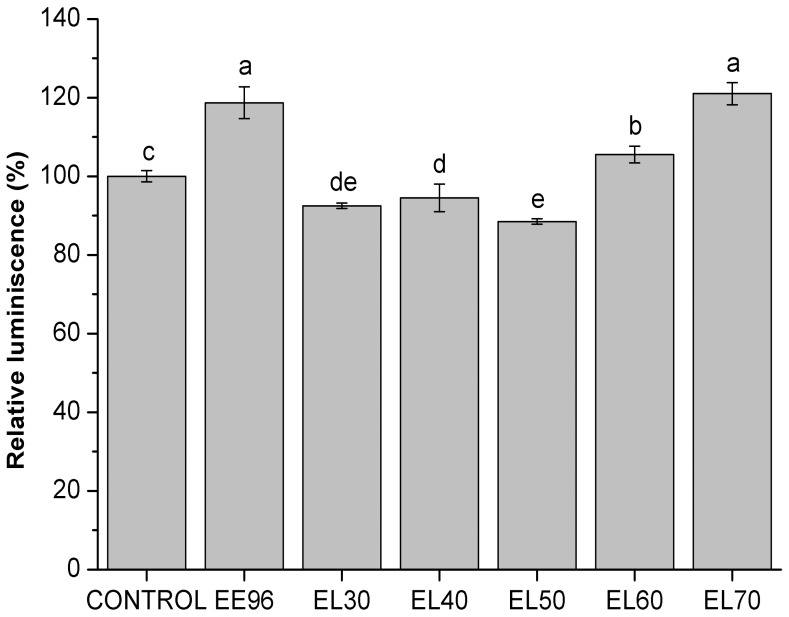
Figure 5. Cellular metabolic energy in the yeast S. cerevisiae treated with EE96 and EL30 to EL70 eluates (1%).
Data are means ±S.D. (n = 3) and are expressed as luminescence relative to control. Values followed by the same letter (a–e) are not statistically different (P<0.05), as measured by Duncan’s test.

