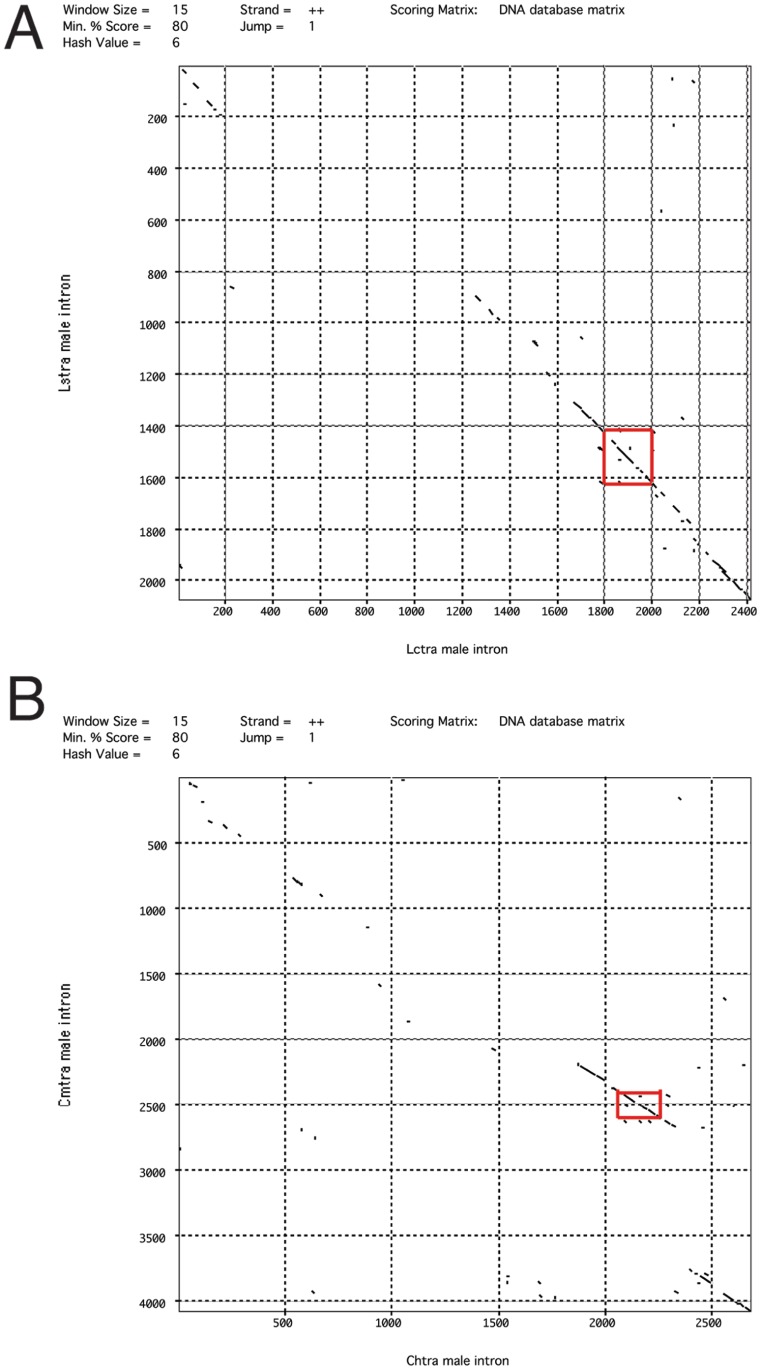
Figure 3. DNA dot matrices of blowfly tra male intron DNA sequences.
(A). A comparison of Lucilia tra intron sequences with Lstra on the vertical axis and Lctra on the horizontal. (B) A comparison of Cochliomyia tra intron sequences with Cmtra on the vertical axis and Chtra on the horizontal. The regions containing the cluster of TRA/TRA2 sites are highlighted with a red box.

