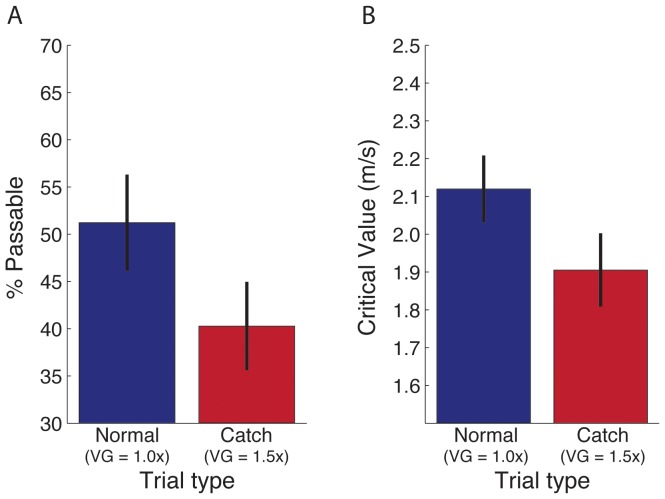
Figure 5. Experiment 1 results.
Percentage of passable judgments (A) and critical value of required speed (B) in Experiment 1. Error bars indicate ±1 SE. Note that the estimate of critical required speed on normal trials in (B) is based on data from all 15 initial conditions. It is also possible to estimate critical required speed based on the data from the subset of normal trials with initial conditions that match those on catch trials. When critical required speed is estimated using the latter method, the mean and standard error (M = 2.14 m/s, SE = 0.09) are nearly identical to the mean and standard error based on the data from all normal trials (M = 2.12 m/s, SE = 0.09).

