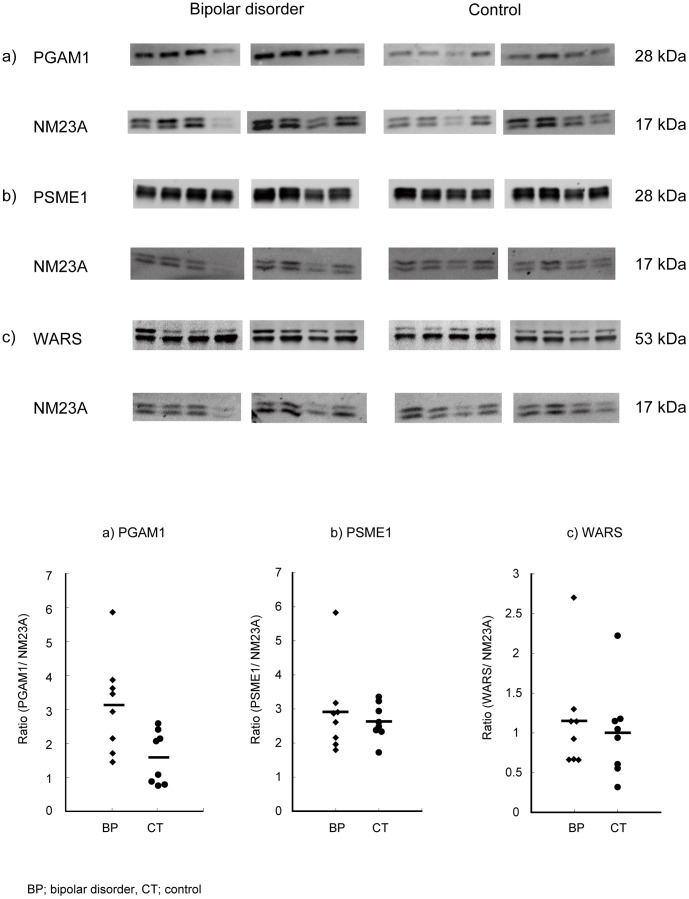
Figure 2. Protein expression validation by Western blot analysis with an internal standard, NM23A.
Proteins from each of the eight pairs of samples were separated by SDS-PAGE and transferred to PVDF membranes. Proteins were immunodetected using the respective primary antibodies and fluorescent secondary antibodies. Signals were captured with FX and signal intensity and shown by the. a) PGAM1, b) PSME1, c) WARS. Scatter plots show the ratio of each protein to an internal standard protein, NM23A, measured by densitometric scanning of the band intensities. The p values were calculated using a t test in all proteins. Number of the subjects is 8 for bipolar disorder and 8 for controls, respectively. The absolute band intensity for the PGAM1 was also significantly higher in patients with bipolar disorder (0.93+/−0.23 [mean +/− standard deviation] [arbitrary unit]) than control subjects (0.39+/−0.18, p<0.0005).

