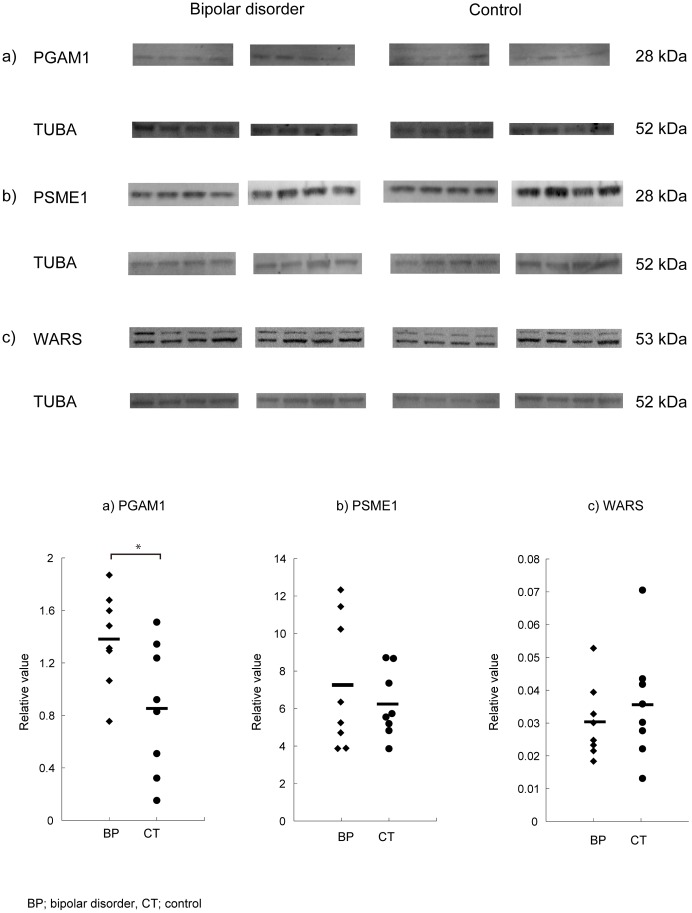
Figure 3. Verification of the alternation of PGAM1 using the other internal protein, tubulin alpha (TUBA).
The methods are similar to the Figure 2, except that tubulin alpha (TUBA) was used for the internal standard. a) PGAM1, b) PSME1, c) WARS. Scatter plots show the ratio of each protein to an internal standard protein, TUBA, measured by densitometric scanning of the band intensities. The PGAM1/TUBA ratio was significantly higher in patients with bipolar disorder compared with controls (p<0.05). Number of the subjects is 8 for bipolar disorder and 8 for controls, respectively.

