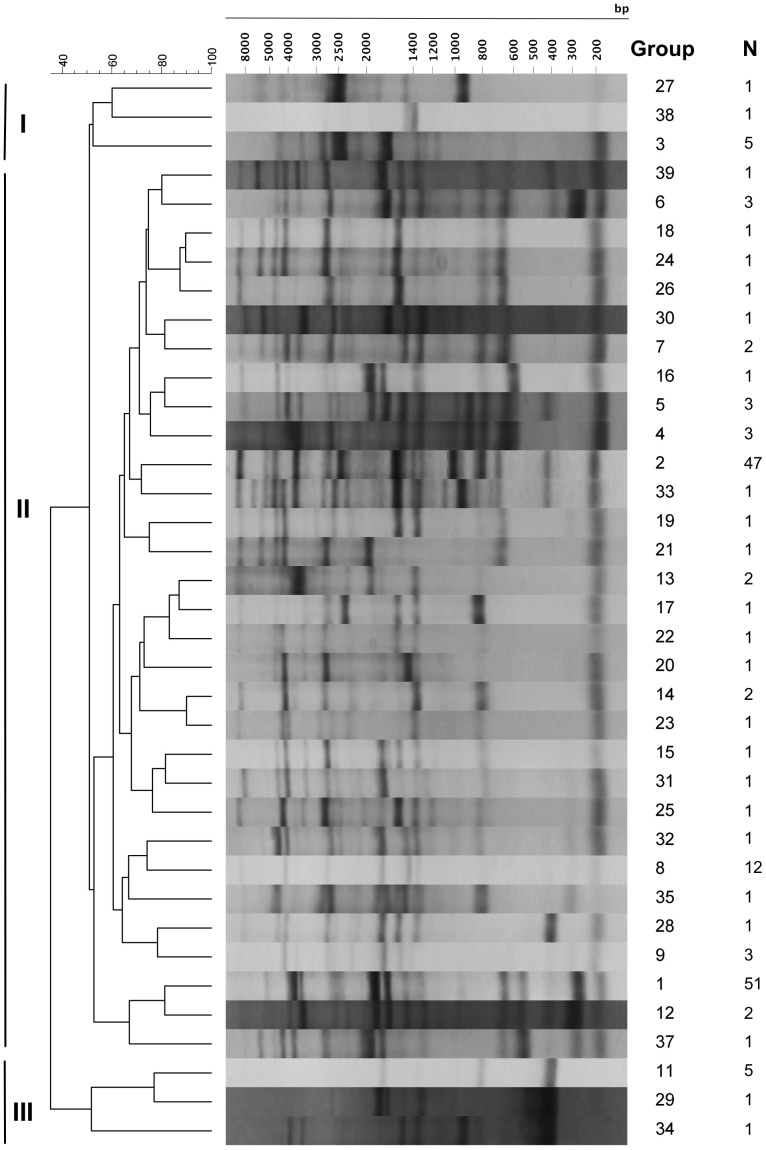
Figure 1. REP-PCR patterns and representative dendrogram.
The electrophoresis banding patterns of 167 V. parahaemolyticus isolates assayed by REP-PCR is shown. BioNumerics analysis of patterns revealed 39 unique REP-PCR groups comprised of N isolates. The corresponding BioNumerics dendrogram illustrates the genetic relatedness between REP-PCR groups, which we grouped into three major clusters (I, II, III). Groups 27, 28 and 3 comprise cluster I while groups 11, 29 and 34 comprise cluster III and all remaining groups comprise cluster II. Electrophoresis banding patterns shown with scale indicating fragment size in base pairs (bp).

