
Figure 5. Alterations in oxidative stress in NCL fibroblasts.
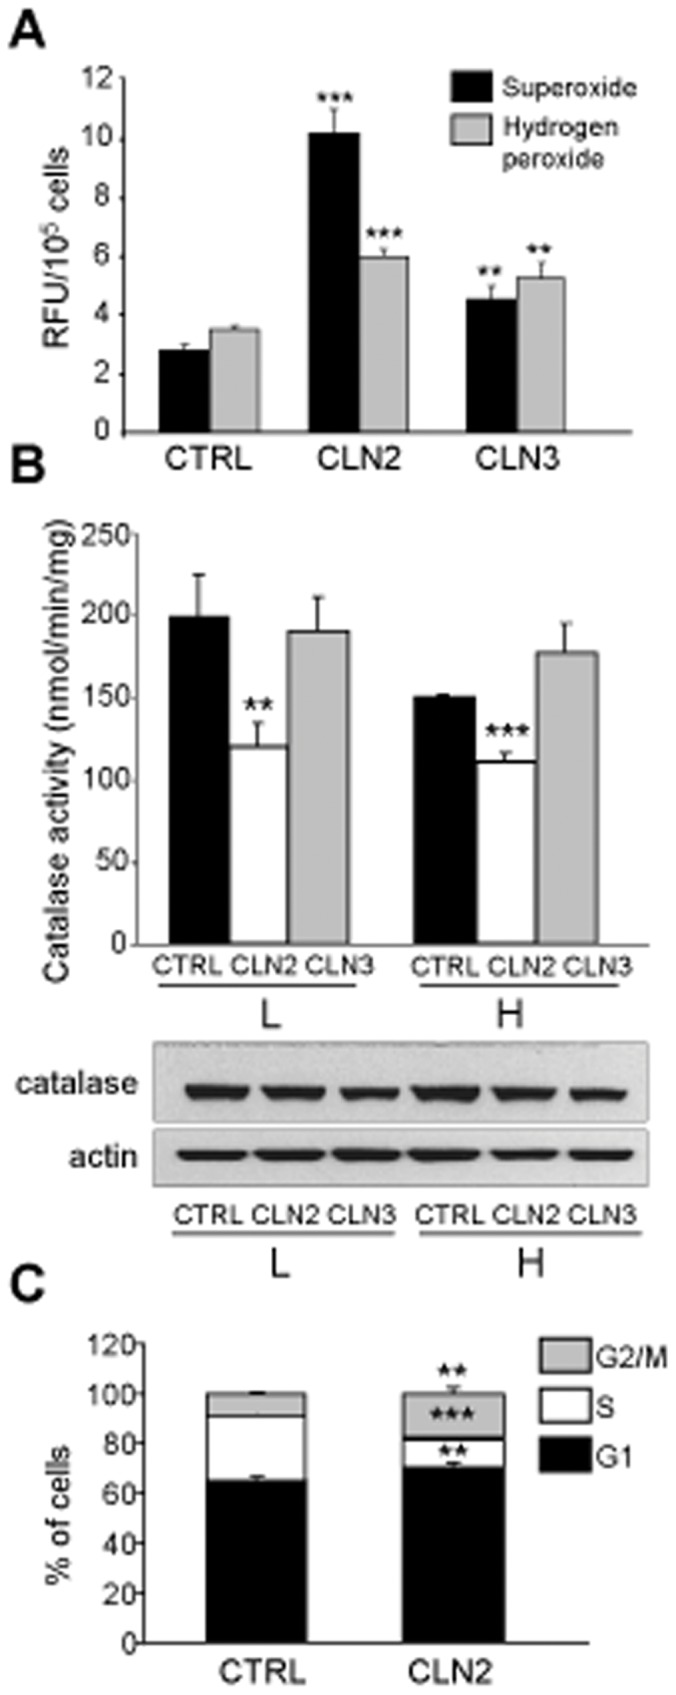
(A) Superoxide and hydrogen peroxide accumulation. Control, CLN2 and CLN3 fibroblasts incubated under high proteolysis conditions were stained with HE and DHR-123 and analyzed by flow cytometry as described in Materials and Methods. Results are shown as RFU values in 105 cells and represent the mean and S.D. from three separate experiments with triplicated samples. Representative dot blots are shown in Figure S3B. (B) Catalase activities and levels. Control (CTRL), CLN2 and CLN3 fibroblasts were incubated under low (L) and high (H) proteolysis conditions during 3 h. Catalase activity was measured as described in Materials and Methods (upper panel), and lysates (50 µg protein) were immunoblotted with catalase and actin antibodies (lower panels). Catalase activity values represent the mean and S.D. from three separate experiments. (C) Cell cycle analysis. Exponentially growing control (CTRL) and CLN2 fibroblasts, incubated in low proteolysis medium, were stained with PI and the distribution of cells in the different phases of the cell cycle was examined by flow cytometry as described in Materials and Methods. Results are shown as percentage of total cells and represent the mean and S.D. from three separate experiments. Representative dot blots and histograms are shown in Figure S3C. Stars indicate statistically significant differences from control values (**p<0.01 and ***p<0.005).