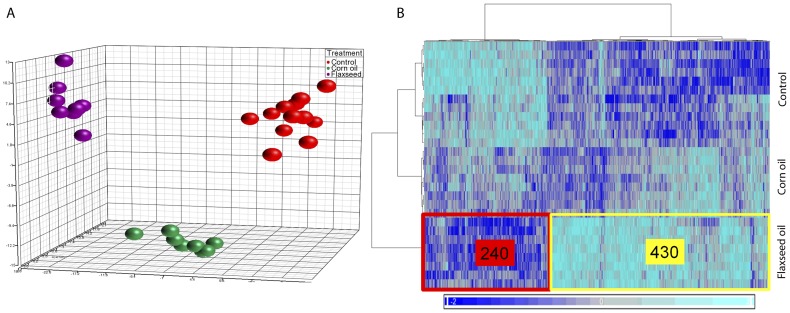
Figure 3. Gene expression changes in the mammary gland.
Test diets were given from two weeks prior to conception to 6 weeks of age, and regular diet thereafter. Microarray analysis was performed at 10 weeks of age. After removing litter-size and batch effects the source of variance was plotted for regular diet (red; n = 12), high-fat diet based on corn oil (green, n = 8) and high-fat diet based on flaxseed oil (magenta, n = 8) using PCA. The heat-map shows clustering of 670 differentially-regulated genes (horizontal) and samples (vertical).

