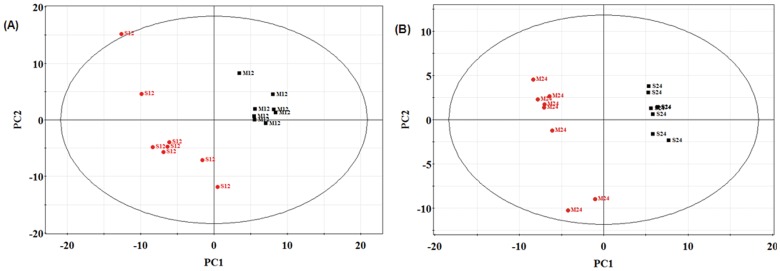
Figure 5. PLS-DA score plots of plasma samples.
(A) PLS-DA score plots of OVX rats and sham rats at the 12th weeks post-surgery; (B) PLS-DA score plots of OVX rats and sham rats at the 24th weeks post-surgery; (C) PLS-DA score plots of OVX rats between the 12th weeks and 24th week post surgery. Letters M and S denotes the OVX group and the Sham group, respectively. Numbers 12 and 24 represents different time points during the experiment: 12, week 12; 24, week 24.

