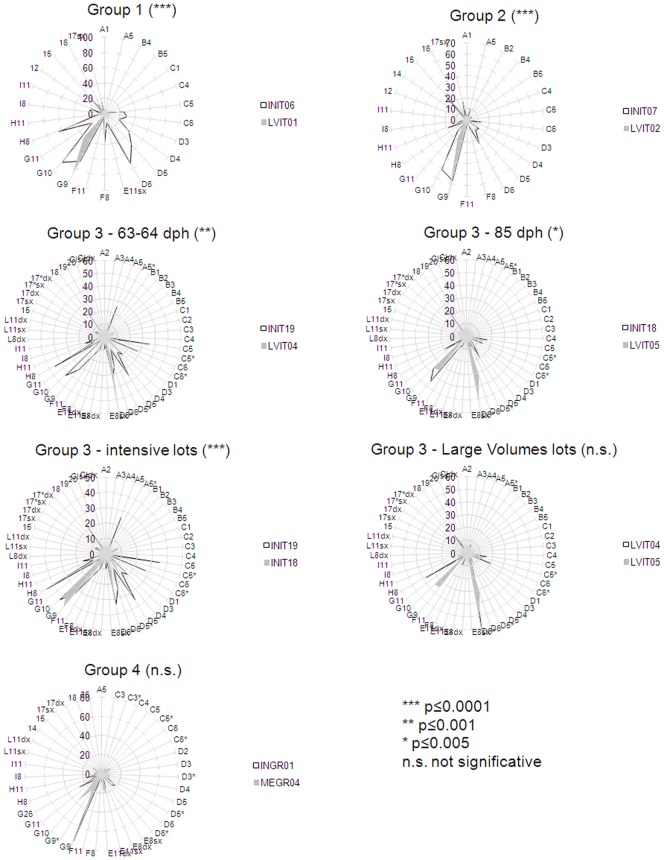
Figure 2. Radar plots showing frequencies of individuals affected by each anomaly, per each group lot.
Group 3 is represented with 4 radar plots: two for the comparison between intensive (INIT19, INIT18) and semi-intensive (LVIT04, LVIT05) siblings at 63–64 dph and at 85 dph; the other two compare intensive lots and semi-intensive lots at different ages, respectively. *** = p≤0.0001; ** = p≤0.001; * = p≤0.005; n.s. = not significant.

