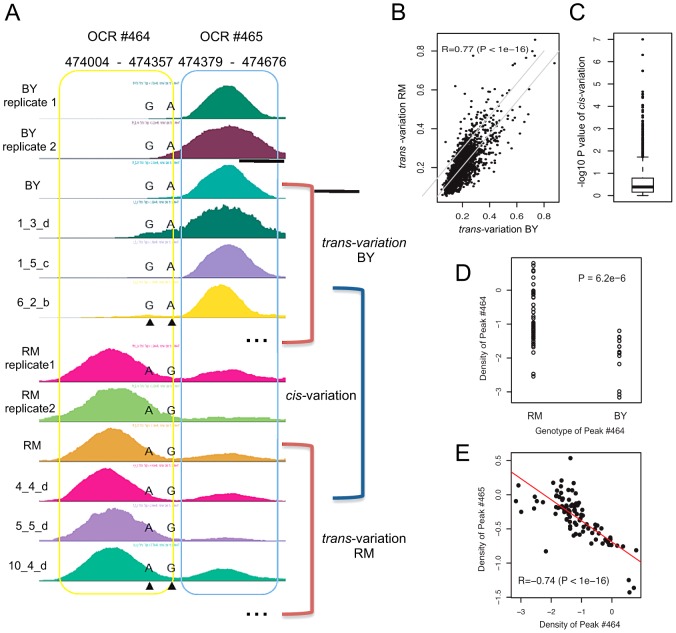
Figure 1. Measurement of trans- and cis-variation.
(A) Sequence effects on chromatin regulation. The two peaks (OCR #464 and OCR #465) are shown for strains with the BY genotype and RM genotype, as determined based on the two SNPs found within OCR #464. (B) The two trans-variation measures were obtained as illustrated in Figure 1A and compared with each other. (C) The significance of cis-variation was measured by the t-test for the 1,738 OCRs. (D) Peak density of OCR #464 as a function of its genotype. (E) Anti-correlation between the peak density of OCR #464 and that of OCR #465 across all yeast strains.

